<< Chapter < Page Chapter >> Page >

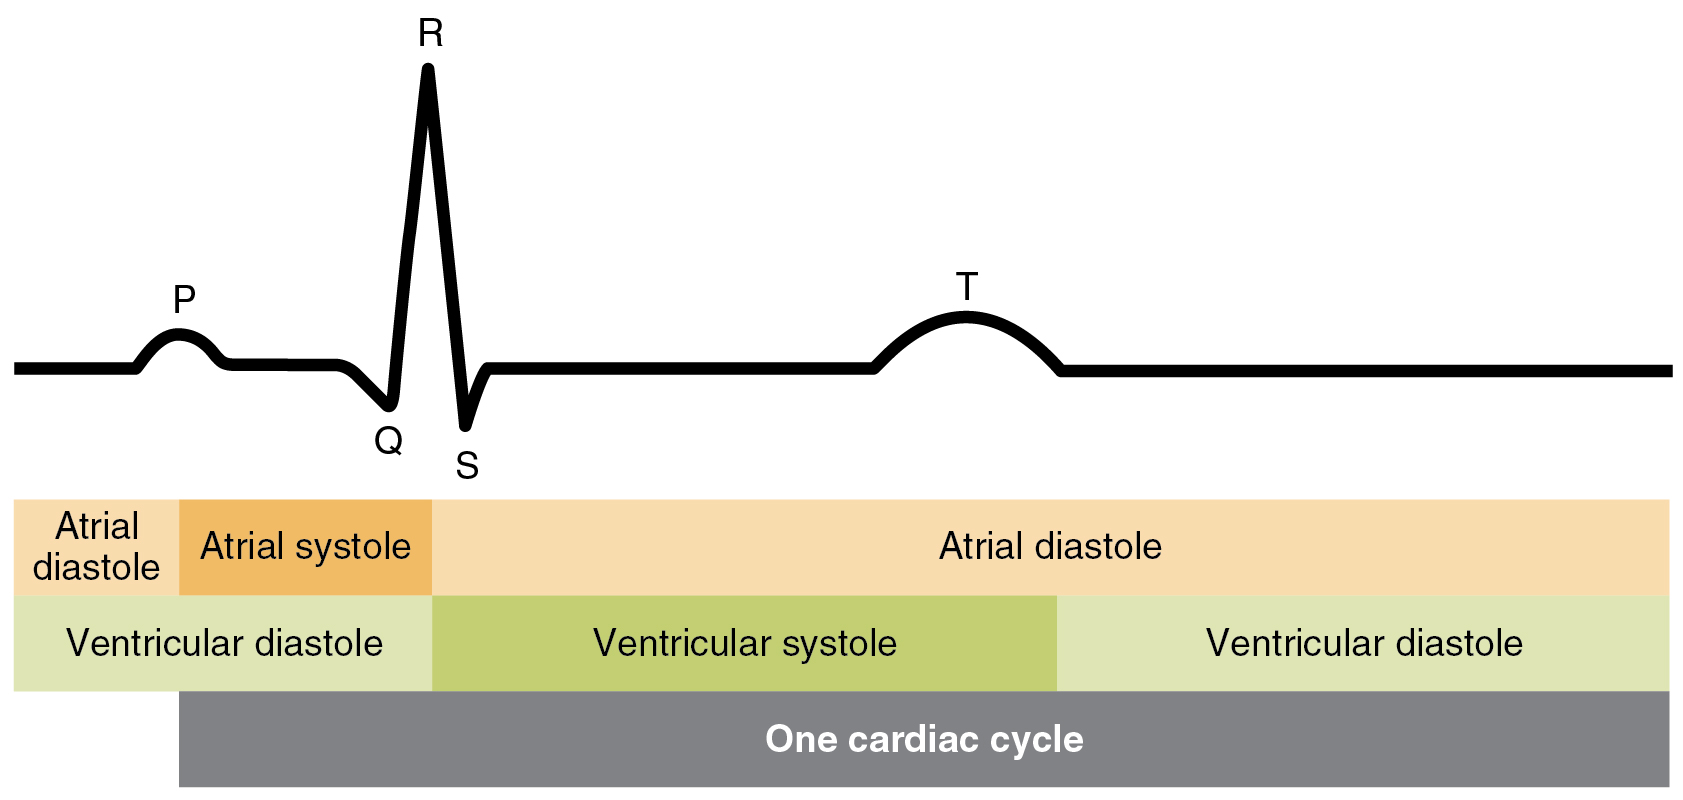
[link] illustrates the relationship between the cardiac cycle and the ECG.

Relationship between the cardiac cycle and ecg

This image shows the correlation between the cardiac cycle and the different stages in a electrocardiogram.
Initially, both the atria and ventricles are relaxed (diastole). The P wave represents depolarization of the atria and is followed by atrial contraction (systole). Atrial systole extends until the QRS complex, at which point, the atria relax. The QRS complex represents depolarization of the ventricles and is followed by ventricular contraction. The T wave represents the repolarization of the ventricles and marks the beginning of ventricular relaxation.

Heart sounds

One of the simplest, yet effective, diagnostic techniques applied to assess the state of a patient’s heart is auscultation using a stethoscope.

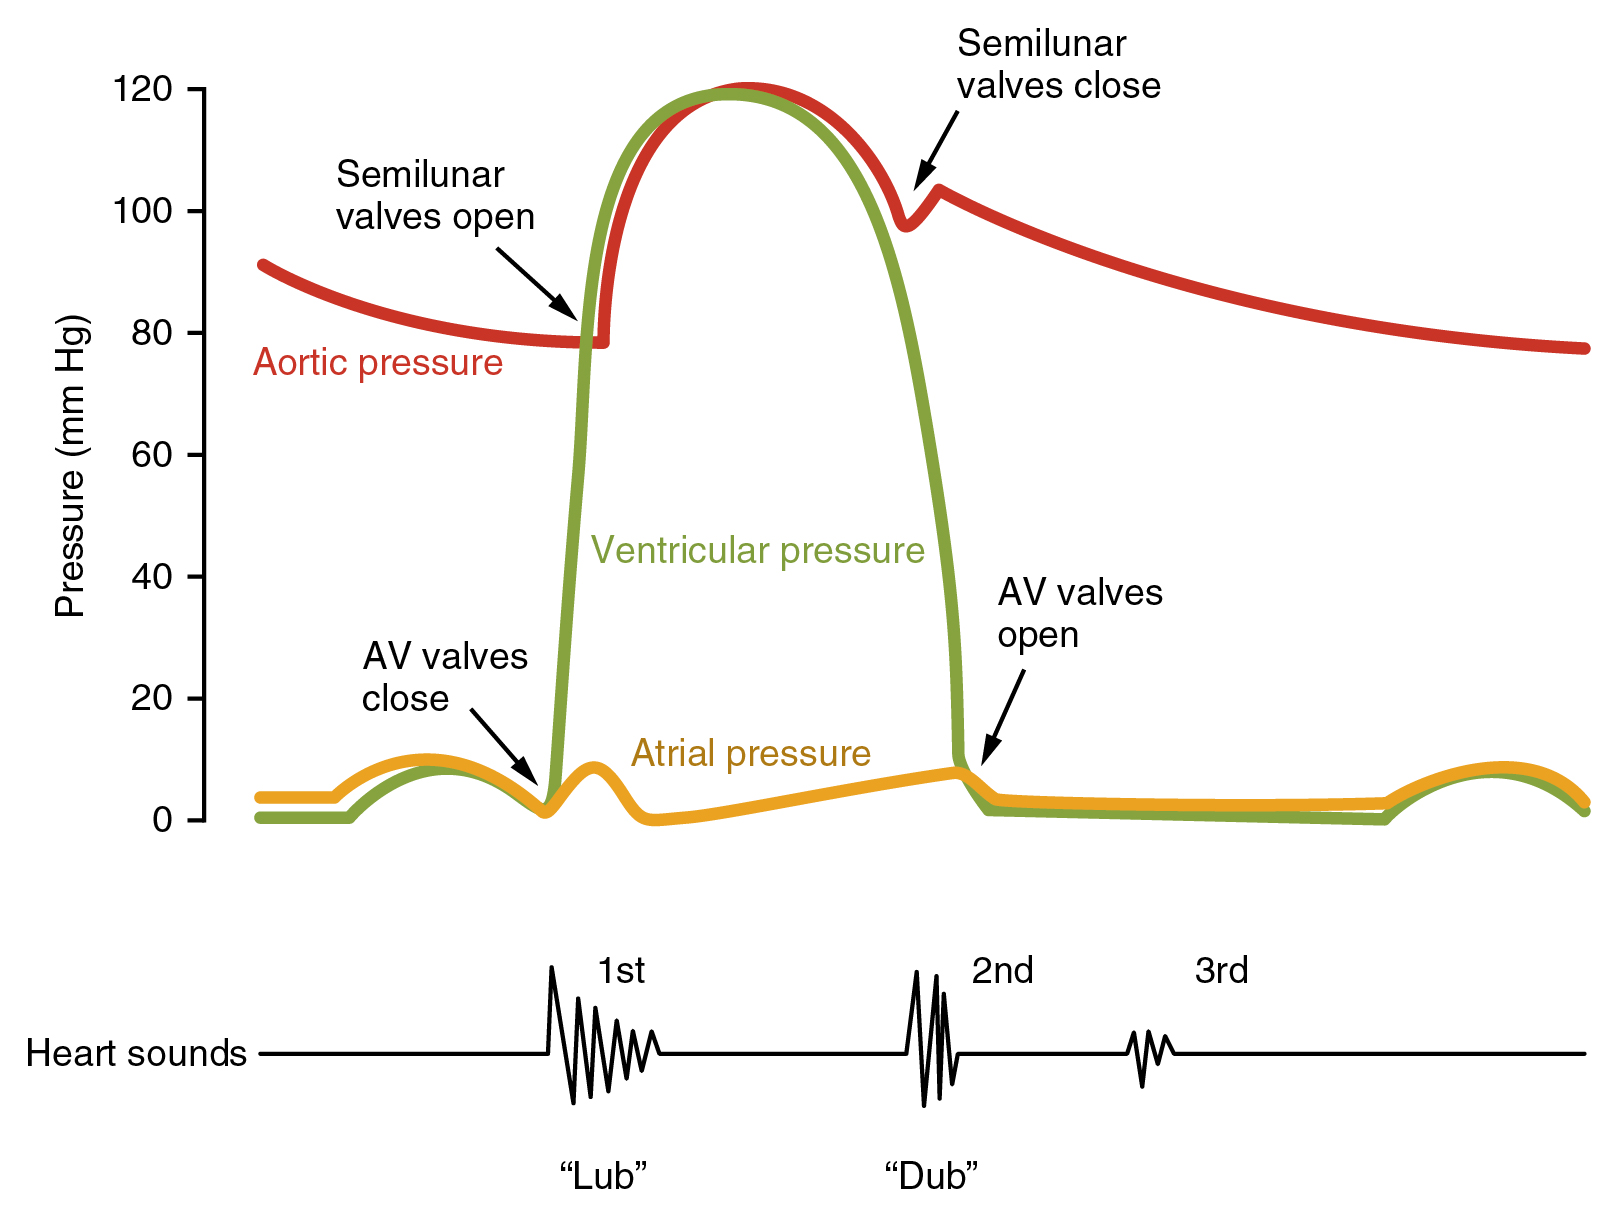
In a normal, healthy heart, there are only two audible heart sounds    : S 1 and S 2 . S 1 is the sound created by the closing of the atrioventricular valves during ventricular contraction and is normally described as a “lub,” or first heart sound. The second heart sound, S 2 , is the sound of the closing of the semilunar valves during ventricular diastole and is described as a “dub” ( [link] ). In both cases, as the valves close, the openings within the atrioventricular septum guarded by the valves will become reduced, and blood flow through the opening will become more turbulent until the valves are fully closed. There is a third heart sound, S 3 , but it is rarely heard in healthy individuals. It may be the sound of blood flowing into the atria, or blood sloshing back and forth in the ventricle, or even tensing of the chordae tendineae. S 3 may be heard in youth, some athletes, and pregnant women. If the sound is heard later in life, it may indicate congestive heart failure, warranting further tests. Some cardiologists refer to the collective S 1 , S 2 , and S 3 sounds as the “Kentucky gallop,” because they mimic those produced by a galloping horse. The fourth heart sound, S 4 , results from the contraction of the atria pushing blood into a stiff or hypertrophic ventricle, indicating failure of the left ventricle. S 4 occurs prior to S 1 and the collective sounds S 4 , S 1 , and S 2 are referred to by some cardiologists as the “Tennessee gallop,” because of their similarity to the sound produced by a galloping horse with a different gait. A few individuals may have both S 3 and S 4 , and this combined sound is referred to as S 7 .

Heart sounds and the cardiac cycle

This image shows a graph of the blood pressure with the different stages labeled. Under the graph, a line shows the different sounds made by the beating heart.
In this illustration, the x-axis reflects time with a recording of the heart sounds. The y-axis represents pressure.

The term murmur    is used to describe an unusual sound coming from the heart that is caused by the turbulent flow of blood. Murmurs are graded on a scale of 1 to 6, with 1 being the most common, the most difficult sound to detect, and the least serious. The most severe is a 6. Phonocardiograms or auscultograms can be used to record both normal and abnormal sounds using specialized electronic stethoscopes.

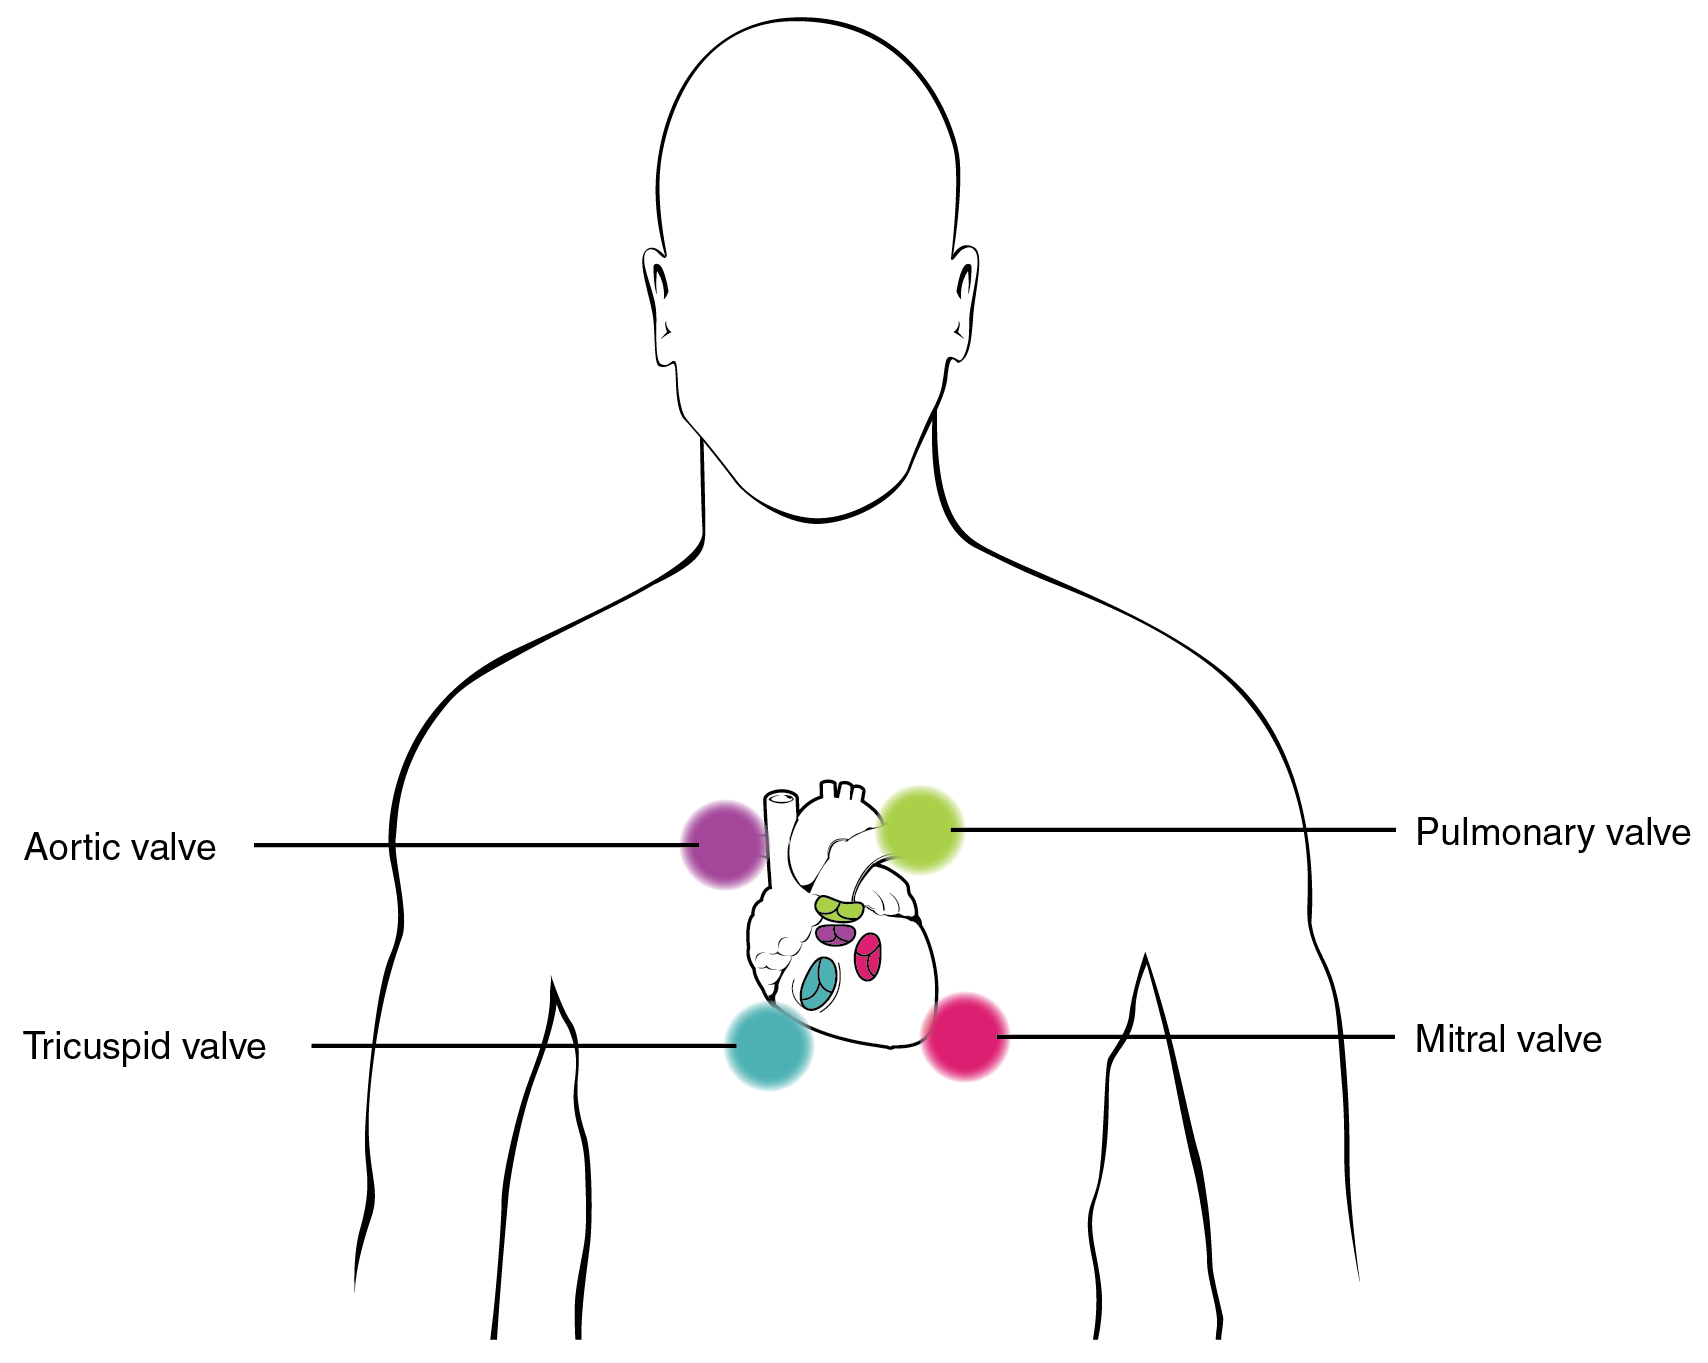
During auscultation, it is common practice for the clinician to ask the patient to breathe deeply. This procedure not only allows for listening to airflow, but it may also amplify heart murmurs. Inhalation increases blood flow into the right side of the heart and may increase the amplitude of right-sided heart murmurs. Expiration partially restricts blood flow into the left side of the heart and may amplify left-sided heart murmurs. [link] indicates proper placement of the bell of the stethoscope to facilitate auscultation.

Stethoscope placement for auscultation

This image shows the points on the human chest where the stethoscope can be placed to hear the heart beat.
Proper placement of the bell of the stethoscope facilitates auscultation. At each of the four locations on the chest, a different valve can be heard.

Chapter review

The cardiac cycle comprises a complete relaxation and contraction of both the atria and ventricles, and lasts approximately 0.8 seconds. Beginning with all chambers in diastole, blood flows passively from the veins into the atria and past the atrioventricular valves into the ventricles. The atria begin to contract (atrial systole), following depolarization of the atria, and pump blood into the ventricles. The ventricles begin to contract (ventricular systole), raising pressure within the ventricles. When ventricular pressure rises above the pressure in the atria, blood flows toward the atria, producing the first heart sound, S 1 or lub. As pressure in the ventricles rises above two major arteries, blood pushes open the two semilunar valves and moves into the pulmonary trunk and aorta in the ventricular ejection phase. Following ventricular repolarization, the ventricles begin to relax (ventricular diastole), and pressure within the ventricles drops. As ventricular pressure drops, there is a tendency for blood to flow back into the atria from the major arteries, producing the dicrotic notch in the ECG and closing the two semilunar valves. The second heart sound, S 2 or dub, occurs when the semilunar valves close. When the pressure falls below that of the atria, blood moves from the atria into the ventricles, opening the atrioventricular valves and marking one complete heart cycle. The valves prevent backflow of blood. Failure of the valves to operate properly produces turbulent blood flow within the heart; the resulting heart murmur can often be heard with a stethoscope.

Questions & Answers

What are the factors that affect demand for a commodity
Florence Reply
differentiate between demand and supply giving examples
Lambiv Reply
differentiated between demand and supply using examples
Lambiv
what is labour ?
Lambiv
how will I do?
Venny Reply
how is the graph works?I don't fully understand
Rezat Reply
information
Eliyee
devaluation
Eliyee
t
WARKISA
hi guys good evening to all
Lambiv
multiple choice question
Aster Reply
appreciation
Eliyee
explain perfect market
Lindiwe Reply
In economics, a perfect market refers to a theoretical construct where all participants have perfect information, goods are homogenous, there are no barriers to entry or exit, and prices are determined solely by supply and demand. It's an idealized model used for analysis,
Ezea
What is ceteris paribus?
Shukri Reply
other things being equal
AI-Robot
When MP₁ becomes negative, TP start to decline. Extuples Suppose that the short-run production function of certain cut-flower firm is given by: Q=4KL-0.6K2 - 0.112 • Where is quantity of cut flower produced, I is labour input and K is fixed capital input (K-5). Determine the average product of lab
Kelo
Extuples Suppose that the short-run production function of certain cut-flower firm is given by: Q=4KL-0.6K2 - 0.112 • Where is quantity of cut flower produced, I is labour input and K is fixed capital input (K-5). Determine the average product of labour (APL) and marginal product of labour (MPL)
Kelo
yes,thank you
Shukri
Can I ask you other question?
Shukri
what is monopoly mean?
Habtamu Reply
What is different between quantity demand and demand?
Shukri Reply
Quantity demanded refers to the specific amount of a good or service that consumers are willing and able to purchase at a give price and within a specific time period. Demand, on the other hand, is a broader concept that encompasses the entire relationship between price and quantity demanded
Ezea
ok
Shukri
how do you save a country economic situation when it's falling apart
Lilia Reply
what is the difference between economic growth and development
Fiker Reply
Economic growth as an increase in the production and consumption of goods and services within an economy.but Economic development as a broader concept that encompasses not only economic growth but also social & human well being.
Shukri
production function means
Jabir
What do you think is more important to focus on when considering inequality ?
Abdisa Reply
any question about economics?
Awais Reply
sir...I just want to ask one question... Define the term contract curve? if you are free please help me to find this answer 🙏
Asui
it is a curve that we get after connecting the pareto optimal combinations of two consumers after their mutually beneficial trade offs
Awais
thank you so much 👍 sir
Asui
In economics, the contract curve refers to the set of points in an Edgeworth box diagram where both parties involved in a trade cannot be made better off without making one of them worse off. It represents the Pareto efficient allocations of goods between two individuals or entities, where neither p
Cornelius
In economics, the contract curve refers to the set of points in an Edgeworth box diagram where both parties involved in a trade cannot be made better off without making one of them worse off. It represents the Pareto efficient allocations of goods between two individuals or entities,
Cornelius
Suppose a consumer consuming two commodities X and Y has The following utility function u=X0.4 Y0.6. If the price of the X and Y are 2 and 3 respectively and income Constraint is birr 50. A,Calculate quantities of x and y which maximize utility. B,Calculate value of Lagrange multiplier. C,Calculate quantities of X and Y consumed with a given price. D,alculate optimum level of output .
Feyisa Reply
Answer
Feyisa
c
Jabir
the market for lemon has 10 potential consumers, each having an individual demand curve p=101-10Qi, where p is price in dollar's per cup and Qi is the number of cups demanded per week by the i th consumer.Find the market demand curve using algebra. Draw an individual demand curve and the market dema
Gsbwnw Reply
suppose the production function is given by ( L, K)=L¼K¾.assuming capital is fixed find APL and MPL. consider the following short run production function:Q=6L²-0.4L³ a) find the value of L that maximizes output b)find the value of L that maximizes marginal product
Abdureman
Got questions? Join the online conversation and get instant answers!
Jobilize.com Reply

Get Jobilize Job Search Mobile App in your pocket Now!

Get it on Google Play Download on the App Store Now


Source:  OpenStax, Anatomy & Physiology. OpenStax CNX. Feb 04, 2016 Download for free at http://legacy.cnx.org/content/col11496/1.8
Google Play and the Google Play logo are trademarks of Google Inc.

Notification Switch

Would you like to follow the 'Anatomy & Physiology' conversation and receive update notifications?

Ask