| << Chapter < Page | Chapter >> Page > |
Plot each point in a rectangular coordinate system and identify the quadrant in which the point is located:
ⓐ ⓑ ⓒ ⓓ ⓔ .
Plot each point in a rectangular coordinate system and identify the quadrant in which the point is located:
ⓐ ⓑ ⓒ ⓓ ⓔ .
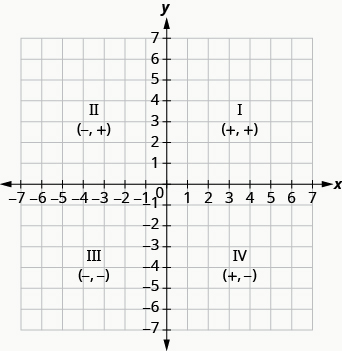
How do the signs affect the location of the points? You may have noticed some patterns as you graphed the points in the previous example.
For the point in [link] in Quadrant IV, what do you notice about the signs of the coordinates? What about the signs of the coordinates of points in the third quadrant? The second quadrant? The first quadrant?
Can you tell just by looking at the coordinates in which quadrant the point is located? In which quadrant is located?
We can summarize sign patterns of the quadrants in this way.
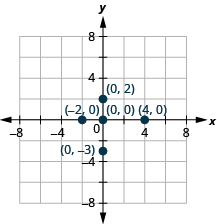
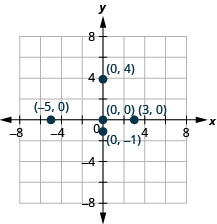
What if one coordinate is zero as shown in [link] ? Where is the point located? Where is the point located?
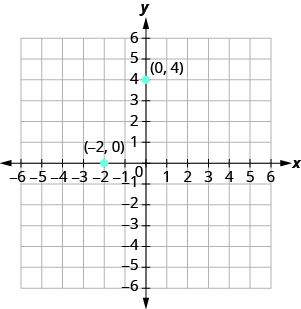
The point is on the y -axis and the point is on the x -axis.
Points with a y -coordinate equal to 0 are on the x -axis, and have coordinates .
Points with an x -coordinate equal to 0 are on the y -axis, and have coordinates .
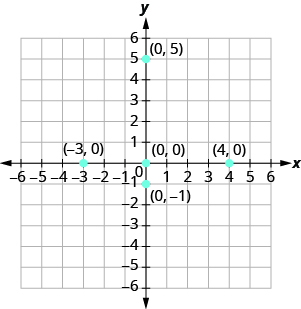
Plot each point:
ⓐ ⓑ ⓒ ⓓ ⓔ .
In algebra, being able to identify the coordinates of a point shown on a graph is just as important as being able to plot points. To identify the x -coordinate of a point on a graph, read the number on the x -axis directly above or below the point. To identify the y -coordinate of a point, read the number on the y -axis directly to the left or right of the point. Remember, when you write the ordered pair use the correct order, .
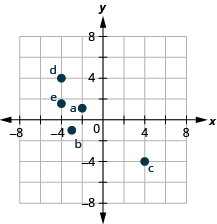
Name the ordered pair of each point shown in the rectangular coordinate system.
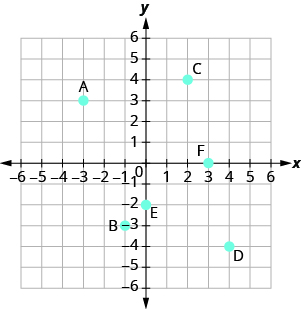
Point A is above on the x -axis, so the x -coordinate of the point is .
Point B is below on the x -axis, so the x -coordinate of the point is .
Point C is above 2 on the x -axis, so the x -coordinate of the point is 2.
Point D is below 4 on the x -axis, so the x -coordinate of the point is 4.
Point E is on the y -axis at . The coordinates of point E are
Point F is on the x -axis at . The coordinates of point F are
Notification Switch
Would you like to follow the 'Elementary algebra' conversation and receive update notifications?

|
|

|
|

|
|

|
|

|
|

|
|

|
|

|
|
|
|
|

|