| << Chapter < Page | Chapter >> Page > |
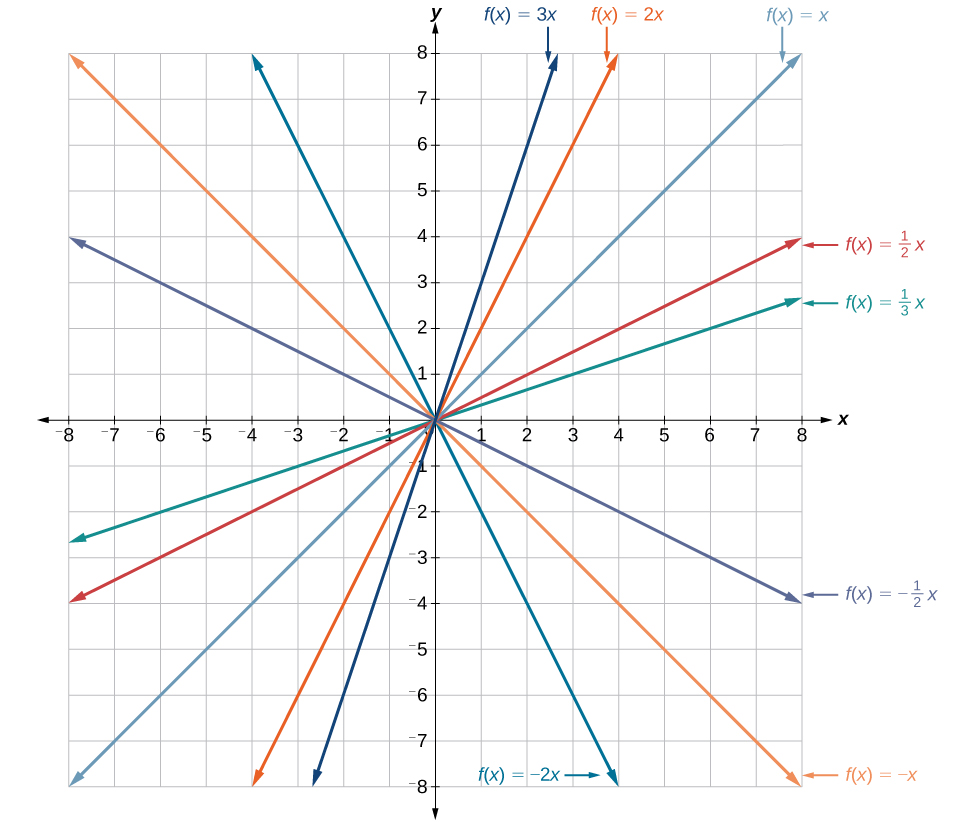
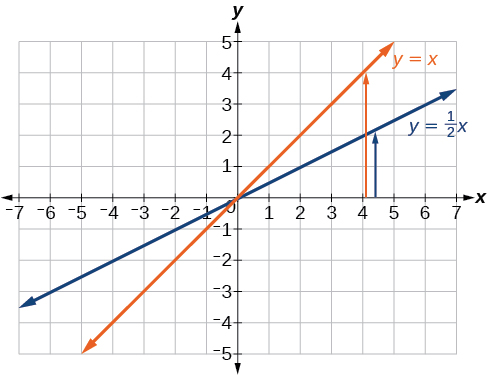
In the equation the is acting as the vertical stretch or compression of the identity function. When is negative, there is also a vertical reflection of the graph. Notice in [link] that multiplying the equation of by stretches the graph of by a factor of units if and compresses the graph of by a factor of units if This means the larger the absolute value of the steeper the slope.
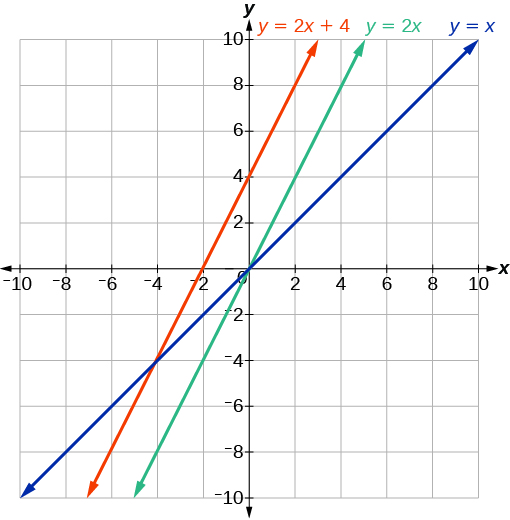
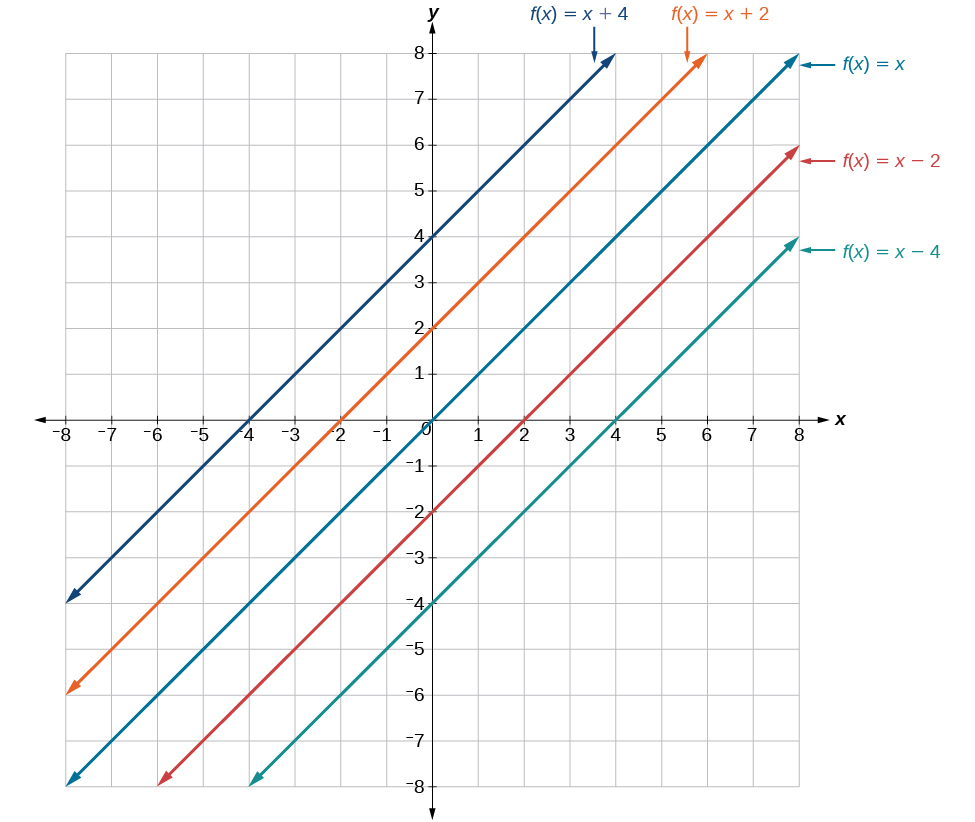
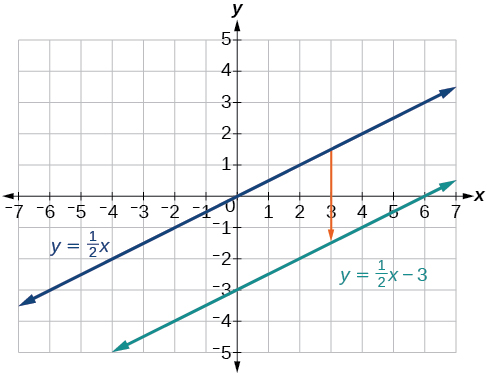
In the acts as the vertical shift , moving the graph up and down without affecting the slope of the line. Notice in [link] that adding a value of to the equation of shifts the graph of a total of units up if is positive and units down if is negative.
Using vertical stretches or compressions along with vertical shifts is another way to look at identifying different types of linear functions. Although this may not be the easiest way to graph this type of function, it is still important to practice each method.
Given the equation of a linear function, use transformations to graph the linear function in the form
Graph using transformations.
The equation for the function shows that so the identity function is vertically compressed by The equation for the function also shows that so the identity function is vertically shifted down 3 units. First, graph the identity function, and show the vertical compression as in [link] .
Then show the vertical shift as in [link] .
In [link] , could we have sketched the graph by reversing the order of the transformations?
No. The order of the transformations follows the order of operations. When the function is evaluated at a given input, the corresponding output is calculated by following the order of operations. This is why we performed the compression first. For example, following the order: Let the input be 2.
Earlier, we wrote the equation for a linear function from a graph. Now we can extend what we know about graphing linear functions to analyze graphs a little more closely. Begin by taking a look at [link] . We can see right away that the graph crosses the y -axis at the point so this is the y -intercept.
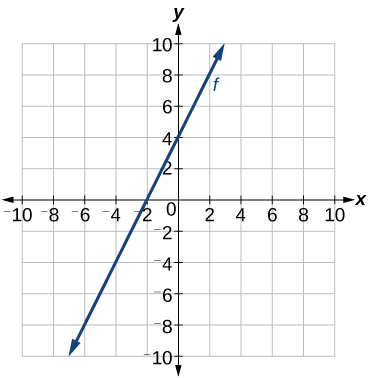
Then we can calculate the slope by finding the rise and run. We can choose any two points, but let’s look at the point To get from this point to the y- intercept, we must move up 4 units (rise) and to the right 2 units (run). So the slope must be
Substituting the slope and y- intercept into the slope-intercept form of a line gives
Notification Switch
Would you like to follow the 'College algebra' conversation and receive update notifications?

|
|
|
|
|

|
|

|
|

|
|
|
|
|

|
|

|
|

|
|

|
|

|
|

|