<< Chapter < Page Chapter >> Page >

Given a logarithmic function, identify the domain.

  1. Set up an inequality showing the argument greater than zero.
  2. Solve for x .
  3. Write the domain in interval notation.

Identifying the domain of a logarithmic shift

What is the domain of f ( x ) = log 2 ( x + 3 ) ?

The logarithmic function is defined only when the input is positive, so this function is defined when x + 3 > 0. Solving this inequality,

x + 3 > 0 The input must be positive . x > 3 Subtract 3 .

The domain of f ( x ) = log 2 ( x + 3 ) is ( 3 , ) .

Got questions? Get instant answers now!

What is the domain of f ( x ) = log 5 ( x 2 ) + 1 ?

( 2 , )

Got questions? Get instant answers now!

Identifying the domain of a logarithmic shift and reflection

What is the domain of f ( x ) = log ( 5 2 x ) ?

The logarithmic function is defined only when the input is positive, so this function is defined when 5 2 x > 0 . Solving this inequality,

5 2 x > 0 The input must be positive . 2 x > 5 Subtract  5. x < 5 2 Divide by  2  and switch the inequality .

The domain of f ( x ) = log ( 5 2 x ) is ( , 5 2 ) .

Got questions? Get instant answers now!

What is the domain of f ( x ) = log ( x 5 ) + 2 ?

( 5 , )

Got questions? Get instant answers now!

Graphing logarithmic functions

Now that we have a feel for the set of values for which a logarithmic function is defined, we move on to graphing logarithmic functions. The family of logarithmic functions includes the parent function y = log b ( x ) along with all its transformations: shifts, stretches, compressions, and reflections.

We begin with the parent function y = log b ( x ) . 
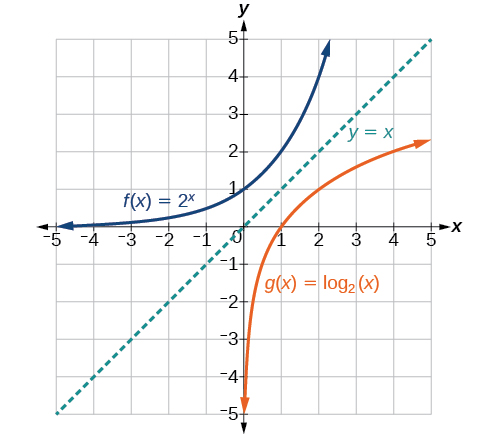
Because every logarithmic function of this form is the inverse of an exponential function with the form y = b x , their graphs will be reflections of each other across the line y = x . To illustrate this, we can observe the relationship between the input and output values of y = 2 x and its equivalent x = log 2 ( y ) in [link] .

x 3 2 1 0 1 2 3
2 x = y 1 8 1 4 1 2 1 2 4 8
log 2 ( y ) = x 3 2 1 0 1 2 3

Using the inputs and outputs from [link] , we can build another table to observe the relationship between points on the graphs of the inverse functions f ( x ) = 2 x and g ( x ) = log 2 ( x ) . See [link] .

f ( x ) = 2 x ( 3 , 1 8 ) ( 2 , 1 4 ) ( 1 , 1 2 ) ( 0 , 1 ) ( 1 , 2 ) ( 2 , 4 ) ( 3 , 8 )
g ( x ) = log 2 ( x ) ( 1 8 , 3 ) ( 1 4 , 2 ) ( 1 2 , 1 ) ( 1 , 0 ) ( 2 , 1 ) ( 4 , 2 ) ( 8 , 3 )

As we’d expect, the x - and y -coordinates are reversed for the inverse functions. [link] shows the graph of f and g .

Graph of two functions, f(x)=2^x and g(x)=log_2(x), with the line y=x denoting the axis of symmetry.
Notice that the graphs of f ( x ) = 2 x and g ( x ) = log 2 ( x ) are reflections about the line y = x .

Observe the following from the graph:

  • f ( x ) = 2 x has a y -intercept at ( 0 , 1 ) and g ( x ) = log 2 ( x ) has an x - intercept at ( 1 , 0 ) .
  • The domain of f ( x ) = 2 x , ( , ) , is the same as the range of g ( x ) = log 2 ( x ) .
  • The range of f ( x ) = 2 x , ( 0 , ) , is the same as the domain of g ( x ) = log 2 ( x ) .

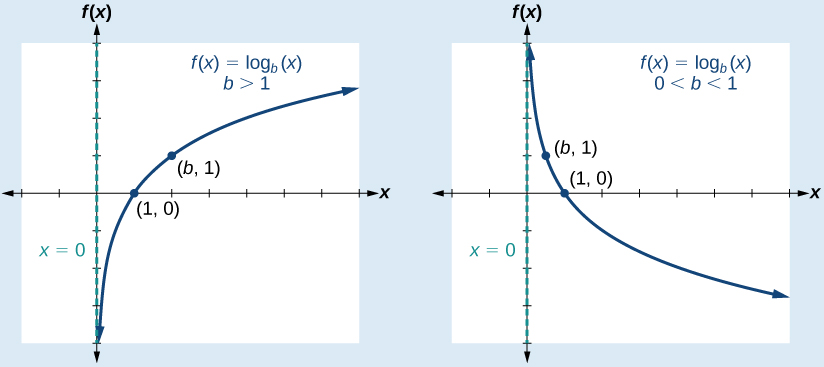
Characteristics of the graph of the parent function, f ( x ) = log b ( x )

For any real number x and constant b > 0 , b 1 , we can see the following characteristics in the graph of f ( x ) = log b ( x ) :

  • one-to-one function
  • vertical asymptote: x = 0
  • domain: ( 0 , )
  • range: ( , )
  • x- intercept: ( 1 , 0 ) and key point ( b , 1 )
  • y -intercept: none
  • increasing if b > 1
  • decreasing if 0 < b < 1

See [link] .

Two graphs of the function f(x)=log_b(x) with points (1,0) and (b, 1). The first graph shows the line when b>1, and the second graph shows the line when 0<b<1.

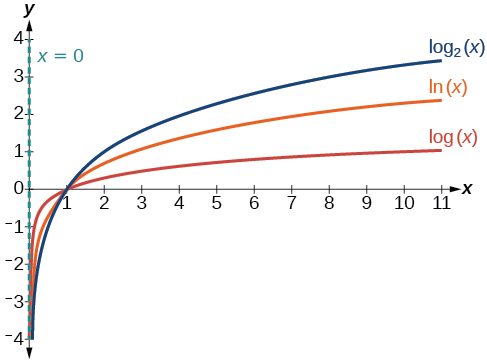
[link] shows how changing the base b in f ( x ) = log b ( x ) can affect the graphs. Observe that the graphs compress vertically as the value of the base increases. ( Note: recall that the function ln ( x ) has base e 2 . 718.)

Graph of three equations: y=log_2(x) in blue, y=ln(x) in orange, and y=log(x) in red. The y-axis is the asymptote.
The graphs of three logarithmic functions with different bases, all greater than 1.

Questions & Answers

what does mean opportunity cost?
Aster Reply
what is poetive effect of population growth
Solomon Reply
what is inflation
Nasir Reply
what is demand
Eleni
what is economics
IMLAN Reply
economics theory describes individual behavior as the result of a process of optimization under constraints the objective to be reached being determined by
Kalkidan
Economics is a branch of social science that deal with How to wise use of resource ,s
Kassie
need
WARKISA
Economic Needs: In economics, needs are goods or services that are necessary for maintaining a certain standard of living. This includes things like healthcare, education, and transportation.
Kalkidan
What is demand and supply
EMPEROR Reply
deman means?
Alex
what is supply?
Alex
ex play supply?
Alex
Money market is a branch or segment of financial market where short-term debt instruments are traded upon. The instruments in this market includes Treasury bills, Bonds, Commercial Papers, Call money among other.
murana Reply
good
Kayode
what is money market
umar Reply
Examine the distinction between theory of comparative cost Advantage and theory of factor proportion
Fatima Reply
What is inflation
Bright Reply
a general and ongoing rise in the level of prices in an economy
AI-Robot
What are the factors that affect demand for a commodity
Florence Reply
price
Kenu
differentiate between demand and supply giving examples
Lambiv Reply
differentiated between demand and supply using examples
Lambiv
what is labour ?
Lambiv
how will I do?
Venny Reply
how is the graph works?I don't fully understand
Rezat Reply
information
Eliyee
devaluation
Eliyee
t
WARKISA
hi guys good evening to all
Lambiv
multiple choice question
Aster Reply
appreciation
Eliyee
explain perfect market
Lindiwe Reply
In economics, a perfect market refers to a theoretical construct where all participants have perfect information, goods are homogenous, there are no barriers to entry or exit, and prices are determined solely by supply and demand. It's an idealized model used for analysis,
Ezea
Got questions? Join the online conversation and get instant answers!
Jobilize.com Reply

Get Jobilize Job Search Mobile App in your pocket Now!

Get it on Google Play Download on the App Store Now


Source:  OpenStax, Algebra and trigonometry. OpenStax CNX. Nov 14, 2016 Download for free at https://legacy.cnx.org/content/col11758/1.6
Google Play and the Google Play logo are trademarks of Google Inc.

Notification Switch

Would you like to follow the 'Algebra and trigonometry' conversation and receive update notifications?

Ask