

| << Chapter < Page | Chapter >> Page > |
Sixty-five randomly selected car salespersons were asked the number of cars they generally sell in one week. Fourteen people answered that they generally sell three cars; nineteen generally sell four cars; twelve generally sell five cars; nine generally sell six cars; eleven generally sell seven cars. Complete the table.
| Data Value (# cars) | Frequency | Relative Frequency | Cumulative Relative Frequency |
|---|---|---|---|
What does the relative frequency column in [link] sum to? Why?
What is the difference between relative frequency and frequency for each data value in [link] ?
The relative frequency shows the proportion of data points that have each value. The frequency tells the number of data points that have each value.
What is the difference between cumulative relative frequency and relative frequency for each data value?
To construct the histogram for the data in [link] , determine appropriate minimum and maximum x and y values and the scaling. Sketch the histogram. Label the horizontal and vertical axes with words. Include numerical scaling.
Answers will vary. One possible histogram is shown:

Construct a frequency polygon for the following:
| Pulse Rates for Women | Frequency |
|---|---|
| 60–69 | 12 |
| 70–79 | 14 |
| 80–89 | 11 |
| 90–99 | 1 |
| 100–109 | 1 |
| 110–119 | 0 |
| 120–129 | 1 |
| Actual Speed in a 30 MPH Zone | Frequency |
|---|---|
| 42–45 | 25 |
| 46–49 | 14 |
| 50–53 | 7 |
| 54–57 | 3 |
| 58–61 | 1 |
| Tar (mg) in Nonfiltered Cigarettes | Frequency |
|---|---|
| 10–13 | 1 |
| 14–17 | 0 |
| 18–21 | 15 |
| 22–25 | 7 |
| 26–29 | 2 |
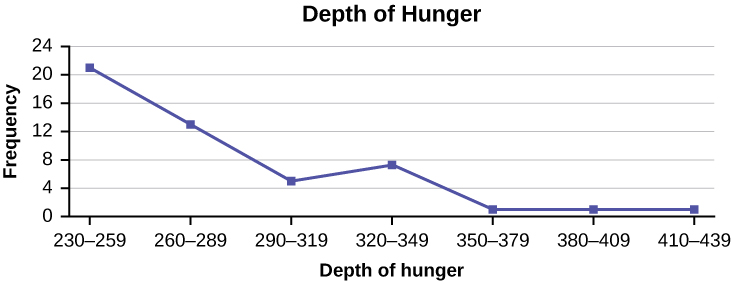
Construct a frequency polygon from the frequency distribution for the 50 highest ranked countries for depth of hunger.
| Depth of Hunger | Frequency |
|---|---|
| 230–259 | 21 |
| 260–289 | 13 |
| 290–319 | 5 |
| 320–349 | 7 |
| 350–379 | 1 |
| 380–409 | 1 |
| 410–439 | 1 |
Find the midpoint for each class. These will be graphed on the x -axis. The frequency values will be graphed on the y -axis values.
Use the two frequency tables to compare the life expectancy of men and women from 20 randomly selected countries. Include an overlayed frequency polygon and discuss the shapes of the distributions, the center, the spread, and any outliers. What can we conclude about the life expectancy of women compared to men?
| Life Expectancy at Birth – Women | Frequency |
|---|---|
| 49–55 | 3 |
| 56–62 | 3 |
| 63–69 | 1 |
| 70–76 | 3 |
| 77–83 | 8 |
| 84–90 | 2 |
| Life Expectancy at Birth – Men | Frequency |
|---|---|
| 49–55 | 3 |
| 56–62 | 3 |
| 63–69 | 1 |
| 70–76 | 1 |
| 77–83 | 7 |
| 84–90 | 5 |
Construct a times series graph for (a) the number of male births, (b) the number of female births, and (c) the total number of births.
| Sex/Year | 1855 | 1856 | 1857 | 1858 | 1859 | 1860 | 1861 |
| Female | 45,545 | 49,582 | 50,257 | 50,324 | 51,915 | 51,220 | 52,403 |
| Male | 47,804 | 52,239 | 53,158 | 53,694 | 54,628 | 54,409 | 54,606 |
| Total | 93,349 | 101,821 | 103,415 | 104,018 | 106,543 | 105,629 | 107,009 |
| Sex/Year | 1862 | 1863 | 1864 | 1865 | 1866 | 1867 | 1868 | 1869 |
| Female | 51,812 | 53,115 | 54,959 | 54,850 | 55,307 | 55,527 | 56,292 | 55,033 |
| Male | 55,257 | 56,226 | 57,374 | 58,220 | 58,360 | 58,517 | 59,222 | 58,321 |
| Total | 107,069 | 109,341 | 112,333 | 113,070 | 113,667 | 114,044 | 115,514 | 113,354 |
| Sex/Year | 1871 | 1870 | 1872 | 1871 | 1872 | 1827 | 1874 | 1875 |
| Female | 56,099 | 56,431 | 57,472 | 56,099 | 57,472 | 58,233 | 60,109 | 60,146 |
| Male | 60,029 | 58,959 | 61,293 | 60,029 | 61,293 | 61,467 | 63,602 | 63,432 |
| Total | 116,128 | 115,390 | 118,765 | 116,128 | 118,765 | 119,700 | 123,711 | 123,578 |

The following data sets list full time police per 100,000 citizens along with homicides per 100,000 citizens for the city of Detroit, Michigan during the period from 1961 to 1973.
| Year | 1961 | 1962 | 1963 | 1964 | 1965 | 1966 | 1967 |
| Police | 260.35 | 269.8 | 272.04 | 272.96 | 272.51 | 261.34 | 268.89 |
| Homicides | 8.6 | 8.9 | 8.52 | 8.89 | 13.07 | 14.57 | 21.36 |
| Year | 1968 | 1969 | 1970 | 1971 | 1972 | 1973 |
| Police | 295.99 | 319.87 | 341.43 | 356.59 | 376.69 | 390.19 |
| Homicides | 28.03 | 31.49 | 37.39 | 46.26 | 47.24 | 52.33 |
Notification Switch
Would you like to follow the 'Introductory statistics' conversation and receive update notifications?

|
|
|
|
|

|
|

|
|

|
|

|
|

|
|

|
|

|
|

|
|

|
|

|