

| << Chapter < Page | Chapter >> Page > |
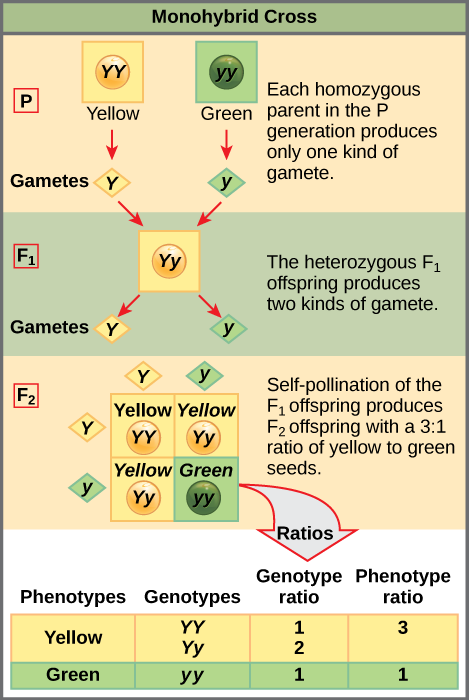
A self-cross of one of the Yy heterozygous offspring can be represented in a 2 × 2 Punnett square because each parent can donate one of two different alleles. Therefore, the offspring can potentially have one of four allele combinations: YY , Yy , yY , or yy ( [link] ). Notice that there are two ways to obtain the Yy genotype: a Y from the egg and a y from the sperm, or a y from the egg and a Y from the sperm. Both of these possibilities must be counted. Recall that Mendel’s pea-plant characteristics behaved in the same way in reciprocal crosses. Therefore, the two possible heterozygous combinations produce offspring that are genotypically and phenotypically identical despite their dominant and recessive alleles deriving from different parents. They are grouped together. Because fertilization is a random event, we expect each combination to be equally likely and for the offspring to exhibit a ratio of YY : Yy : yy genotypes of 1:2:1 ( [link] ). Furthermore, because the YY and Yy offspring have yellow seeds and are phenotypically identical, applying the sum rule of probability, we expect the offspring to exhibit a phenotypic ratio of 3 yellow:1 green. Indeed, working with large sample sizes, Mendel observed approximately this ratio in every F 2 generation resulting from crosses for individual traits.
Mendel validated these results by performing an F 3 cross in which he self-crossed the dominant- and recessive-expressing F 2 plants. When he self-crossed the plants expressing green seeds, all of the offspring had green seeds, confirming that all green seeds had homozygous genotypes of yy . When he self-crossed the F 2 plants expressing yellow seeds, he found that one-third of the plants bred true, and two-thirds of the plants segregated at a 3:1 ratio of yellow:green seeds. In this case, the true-breeding plants had homozygous ( YY ) genotypes, whereas the segregating plants corresponded to the heterozygous ( Yy ) genotype. When these plants self-fertilized, the outcome was just like the F 1 self-fertilizing cross.
Beyond predicting the offspring of a cross between known homozygous or heterozygous parents, Mendel also developed a way to determine whether an organism that expressed a dominant trait was a heterozygote or a homozygote. Called the test cross , this technique is still used by plant and animal breeders. In a test cross, the dominant-expressing organism is crossed with an organism that is homozygous recessive for the same characteristic. If the dominant-expressing organism is a homozygote, then all F 1 offspring will be heterozygotes expressing the dominant trait ( [link] ). Alternatively, if the dominant expressing organism is a heterozygote, the F 1 offspring will exhibit a 1:1 ratio of heterozygotes and recessive homozygotes ( [link] ). The test cross further validates Mendel’s postulate that pairs of unit factors segregate equally.
Notification Switch
Would you like to follow the 'Biology' conversation and receive update notifications?

|
|
|
|
|

|
|

|
|

|
|

|
|

|
|

|
|

|
|

|
|

|
|

|