| << Chapter < Page | Chapter >> Page > |
Use linear regression to determine a function where the year depends on the population, to three decimal places of accuracy.
What is the correlation coefficient for this model to three decimal places of accuracy?
According to the model, what is the population in 2014?
7,660
Determine whether the following algebraic equation can be written as a linear function.
Determine whether the following function is increasing or decreasing.
Decreasing
Determine whether the following function is increasing or decreasing.
Find a linear equation that passes through (5, 1) and (3, –9), if possible.
Find a linear equation, that has an x intercept at (–4, 0) and a y -intercept at (0, –6), if possible.
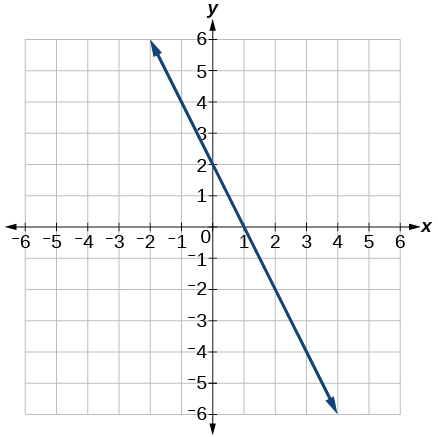
Write an equation for line in [link] .
Does [link] represent a linear function? If so, find a linear equation that models the data.
| –6 | 0 | 2 | 4 | |
| 14 | 32 | 38 | 44 |
Yes,
Does [link] represent a linear function? If so, find a linear equation that models the data.
| x | 1 | 3 | 7 | 11 |
| g ( x ) | 4 | 9 | 19 | 12 |
At 6 am, an online company has sold 120 items that day. If the company sells an average of 30 items per hour for the remainder of the day, write an expression to represent the number of items that were sold after 6 am.
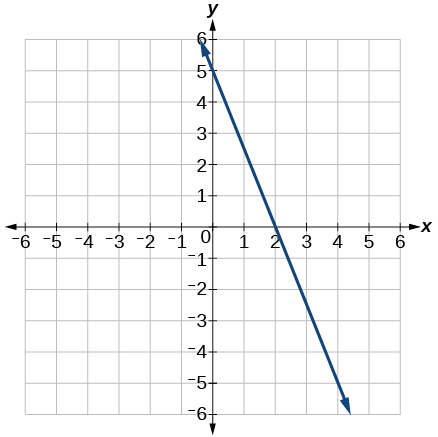
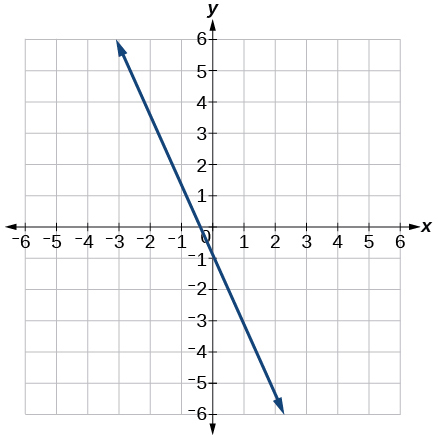
For the following exercises, determine whether the lines given by the equations below are parallel, perpendicular, or neither parallel nor perpendicular.
Find the x - and y -intercepts of the equation
Given below are descriptions of two lines. Find the slopes of Line 1 and Line 2. Is the pair of lines parallel, perpendicular, or neither?
Line 1: Passes through and
Line 2: Passes through and
Line 1: Line 2: parallel
Write an equation for a line perpendicular to and passing through the point
Graph of the linear function
For the two linear functions, find the point of intersection:
A car rental company offers two plans for renting a car.
Plan A: $25 per day and $0.10 per mile
Plan B: $40 per day with free unlimited mileage
How many miles would you need to drive for plan B to save you money?
Find the area of a triangle bounded by the y axis, the line and the line perpendicular to that passes through the origin.
16.94 square units
A town’s population increases at a constant rate. In 2010 the population was 65,000. By 2012 the population had increased to 90,000. Assuming this trend continues, predict the population in 2018.
The number of people afflicted with the common cold in the winter months dropped steadily by 25 each year since 2002 until 2012. In 2002, 8,040 people were inflicted. Find the linear function that models the number of people afflicted with the common cold as a function of the year, When will less than 6,000 people be afflicted?
2083
For the following exercises, use the graph in [link] , showing the profit, in thousands of dollars, of a company in a given year, where represents years since 1980.
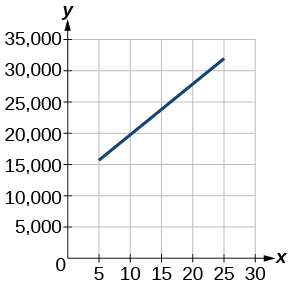
Find the linear function where depends on the number of years since 1980.
Find and interpret the y -intercept.
In 1980, the profit was $10,625,000.
In 2004, a school population was 1250. By 2012 the population had dropped to 875. Assume the population is changing linearly.
Draw a scatter plot for the data provided in [link] . Then determine whether the data appears to be linearly related.
| 0 | 2 | 4 | 6 | 8 | 10 |
| –450 | –200 | 10 | 265 | 500 | 755 |
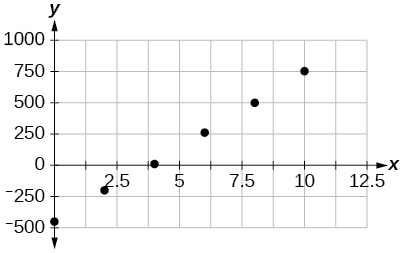
Draw a best-fit line for the plotted data.
For the following exercises, use [link] , which shows the percent of unemployed persons 25 years or older who are college graduates in a particular city, by year.
| Year | 2000 | 2002 | 2005 | 2007 | 2010 |
| Percent Graduates | 8.5 | 8.0 | 7.2 | 6.7 | 6.4 |
Determine whether the trend appears linear. If so, and assuming the trend continues, find a linear regression model to predict the percent of unemployed in a given year to three decimal places.
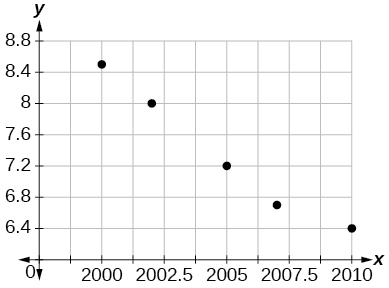
In what year will the percentage drop below 4%?
Based on the set of data given in [link] , calculate the regression line using a calculator or other technology tool, and determine the correlation coefficient. Round to three decimal places of accuracy.
| x | 16 | 18 | 20 | 24 | 26 |
| y | 106 | 110 | 115 | 120 | 125 |
For the following exercises, consider this scenario: The population of a city increased steadily over a ten-year span. The following ordered pairs shows the population (in hundreds) and the year over the ten-year span, (population, year) for specific recorded years:
Use linear regression to determine a function y , where the year depends on the population. Round to three decimal places of accuracy.
What is the correlation coefficient for this model?
Notification Switch
Would you like to follow the 'College algebra' conversation and receive update notifications?

|
|

|
|

|
|

|
|

|
|
|
|
|

|
|

|
|
|
|
|
|
|
|

|