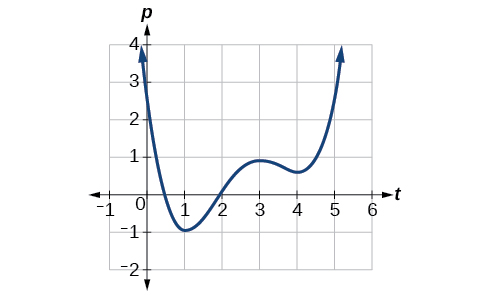
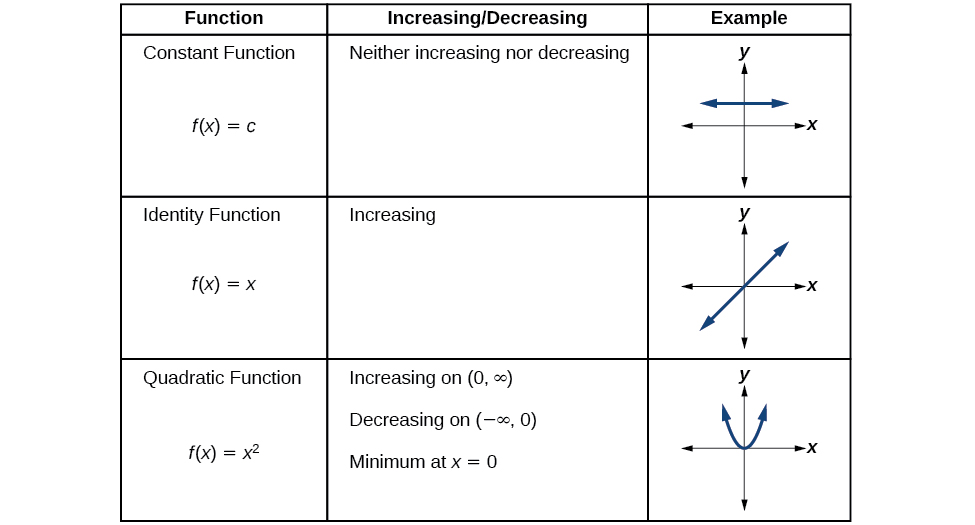
Finding increasing and decreasing intervals on a graph
Given the function
in
[link] , identify the intervals on which the function appears to be increasing.
We see that the function is not constant on any interval. The function is increasing where it slants upward as we move to the right and decreasing where it slants downward as we move to the right. The function appears to be increasing from
to
and from
on.
In
interval notation , we would say the function appears to be increasing on the interval (1,3) and the interval
Graph the function
Then use the graph to estimate the local extrema of the function and to determine the intervals on which the function is increasing.
Using technology, we find that the graph of the function looks like that in
[link] . It appears there is a low point, or local minimum, between
and
and a mirror-image high point, or local maximum, somewhere between
and
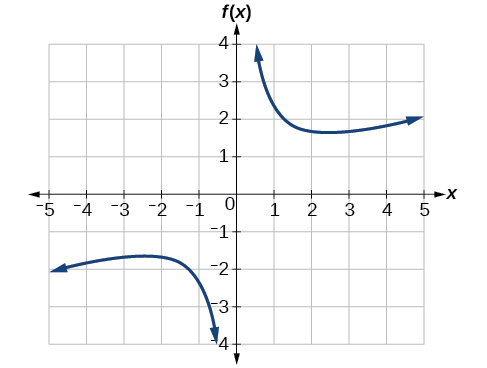
Graph the function
to estimate the local extrema of the function. Use these to determine the intervals on which the function is increasing and decreasing.
The local maximum appears to occur at
and the local minimum occurs at
The function is increasing on
and decreasing on
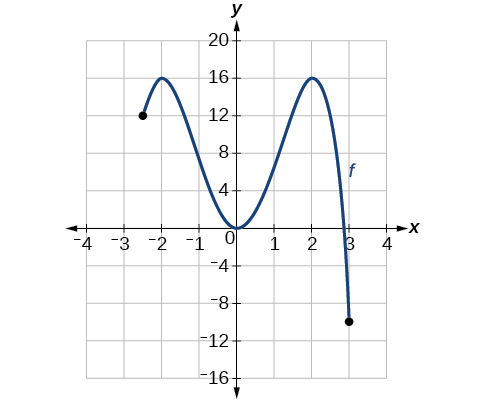
For the function
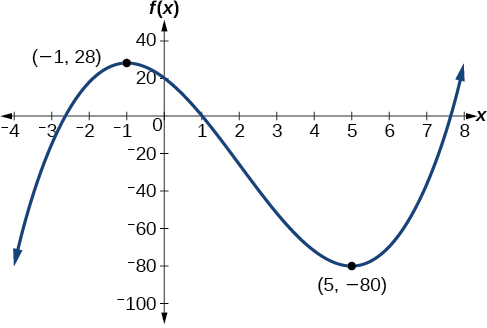
whose graph is shown in
[link] , find all local maxima and minima.
Observe the graph of
The graph attains a local maximum at
because it is the highest point in an open interval around
The local maximum is the
-coordinate at
which is
The graph attains a local minimum at
because it is the lowest point in an open interval around
The local minimum is the
y -coordinate at
which is
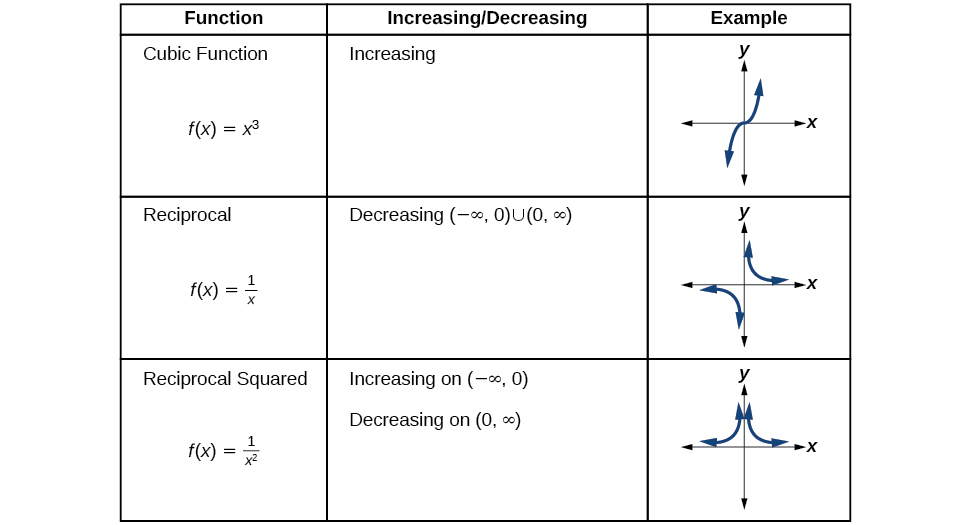
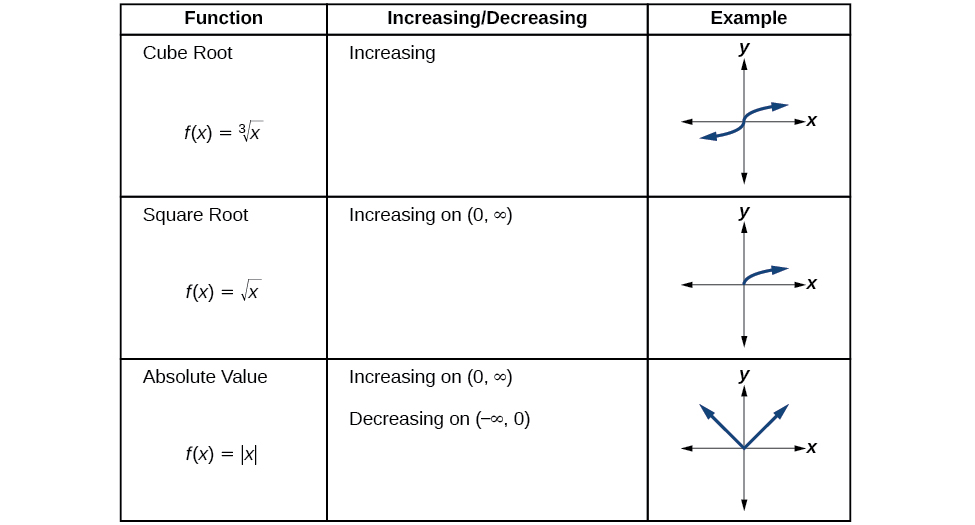
Analyzing the toolkit functions for increasing or decreasing intervals
We will now return to our toolkit functions and discuss their graphical behavior in
[link] ,
[link] , and
[link] .
Use a graph to locate the absolute maximum and absolute minimum
There is a difference between locating the highest and lowest points on a graph in a region around an open interval (locally) and locating the highest and lowest points on the graph for the entire domain. The
coordinates (output) at the highest and lowest points are called the
absolute maximum and
absolute minimum , respectively.
To locate absolute maxima and minima from a graph, we need to observe the graph to determine where the graph attains it highest and lowest points on the domain of the function. See
[link] .
Not every function has an absolute maximum or minimum value. The toolkit function
is one such function.
Absolute maxima and minima
The
absolute maximum of
at
is
where
for all
in the domain of
The
absolute minimum of
at
is
where
for all
in the domain of
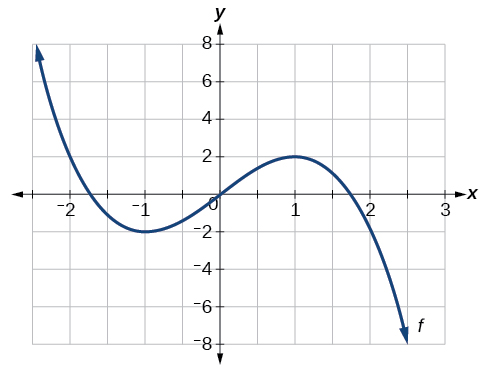
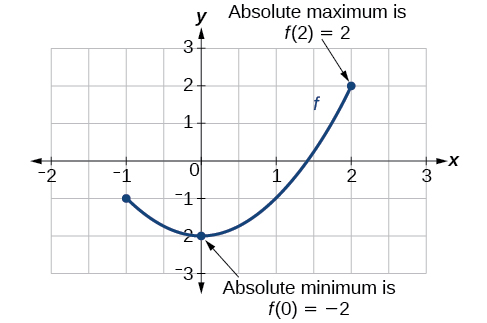
Finding absolute maxima and minima from a graph
For the function
shown in
[link] , find all absolute maxima and minima.
Observe the graph of
The graph attains an absolute maximum in two locations,
and
because at these locations, the graph attains its highest point on the domain of the function. The absolute maximum is the
y -coordinate at
and
which is
The graph attains an absolute minimum at
because it is the lowest point on the domain of the function’s graph. The absolute minimum is the
y -coordinate at
which is
is it possible to leave every good at the same level
Joseph
I don't think so. because check it, if the demand for chicken increases, people will no longer consume fish like they used to causing a fall in the demand for fish
Anuolu
is not really possible to let the value of a goods to be same at the same time.....
Salome
Suppose the inflation rate is 6%, does it mean that all the goods you purchase will cost
6% more than previous year? Provide with reasoning.
Not necessarily. To measure the inflation rate economists normally use an averaged price index of a basket of certain goods. So if you purchase goods included in the basket, you will notice that you pay 6% more, otherwise not necessarily.
Good day
How do I calculate this question: C= 100+5yd G= 2000 T= 2000 I(planned)=200.
Suppose the actual output is 3000. What is the level of planned expenditures at this level of output?
I am Camara from Guinea west Africa... happy to meet you guys here
Sekou
ma management ho
Amisha
ahile becheclor ho
Amisha
hjr ktm bta ho
ani k kaam grnu hunxa tw
Amisha
belatari
Amisha
1st year ho
Amisha
nd u
Amisha
ahh
Amisha
kaha biratnagar
Amisha
ys
Amisha
kina k vo
Amisha
money as unit of account means what?
Kalombe
A unit of account is something that can be used to value goods and services and make calculations
Jim
all of you please speak in English I can't understand you're language
Muhammad
I want to know how can we define macroeconomics in one line
Muhammad
it must be .9 or 0.9
no Mpc is greater than 1
Y=100+.9Y+50
Y-.9Y=150
0.1Y/0.1=150/0.1
Y=1500
Kalombe
Mercy is it clear?😋
Kalombe
hi can someone help me on this question
If a negative shocks shifts the IS curve to the left, what type of policy do you suggest so as to stabilize the level of output?
discuss your answer using appropriate graph.