<< Chapter < Page Chapter >> Page >

Access this online resource for additional instruction and practice with rates of change.

Key equations

Average rate of change Δ y Δ x = f ( x 2 ) f ( x 1 ) x 2 x 1

Key concepts

  • A rate of change relates a change in an output quantity to a change in an input quantity. The average rate of change is determined using only the beginning and ending data. See [link] .
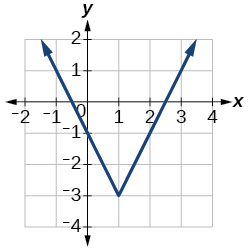
  • Identifying points that mark the interval on a graph can be used to find the average rate of change. See [link] .
  • Comparing pairs of input and output values in a table can also be used to find the average rate of change. See [link] .
  • An average rate of change can also be computed by determining the function values at the endpoints of an interval described by a formula. See [link] and [link] .
  • The average rate of change can sometimes be determined as an expression. See [link] .
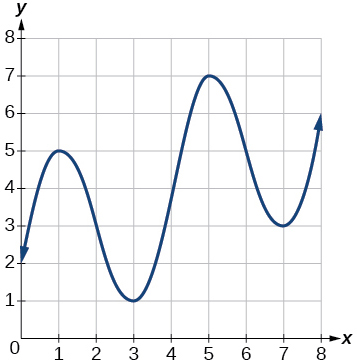
  • A function is increasing where its rate of change is positive and decreasing where its rate of change is negative. See [link] .
  • A local maximum is where a function changes from increasing to decreasing and has an output value larger (more positive or less negative) than output values at neighboring input values.
  • A local minimum is where the function changes from decreasing to increasing (as the input increases) and has an output value smaller (more negative or less positive) than output values at neighboring input values.
  • Minima and maxima are also called extrema.
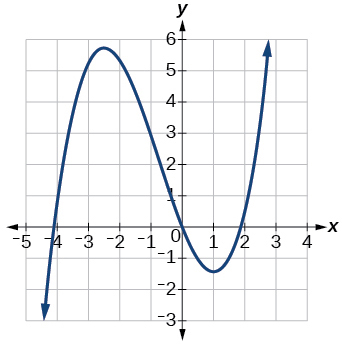
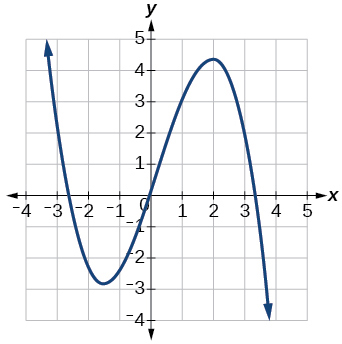
  • We can find local extrema from a graph. See [link] and [link] .
  • The highest and lowest points on a graph indicate the maxima and minima. See [link] .

Section exercises

Verbal

Can the average rate of change of a function be constant?

Yes, the average rate of change of all linear functions is constant.

Got questions? Get instant answers now!

If a function f is increasing on ( a , b ) and decreasing on ( b , c ) , then what can be said about the local extremum of f on ( a , c ) ?

Got questions? Get instant answers now!

How are the absolute maximum and minimum similar to and different from the local extrema?

The absolute maximum and minimum relate to the entire graph, whereas the local extrema relate only to a specific region around an open interval.

Got questions? Get instant answers now!

How does the graph of the absolute value function compare to the graph of the quadratic function, y = x 2 , in terms of increasing and decreasing intervals?

Got questions? Get instant answers now!

Algebraic

For the following exercises, find the average rate of change of each function on the interval specified for real numbers b or h in simplest form.

f ( x ) = 4 x 2 7 on [ 1 ,   b ]

4 ( b + 1 )

Got questions? Get instant answers now!

g ( x ) = 2 x 2 9 on [ 4 ,   b ]

Got questions? Get instant answers now!

p ( x ) = 3 x + 4 on [ 2 ,   2 + h ]

3

Got questions? Get instant answers now!

k ( x ) = 4 x 2 on [ 3 ,   3 + h ]

Got questions? Get instant answers now!

f ( x ) = 2 x 2 + 1 on [ x , x + h ]

4 x + 2 h

Got questions? Get instant answers now!

g ( x ) = 3 x 2 2 on [ x , x + h ]

Got questions? Get instant answers now!

a ( t ) = 1 t + 4 on [ 9 , 9 + h ]

1 13 ( 13 + h )

Got questions? Get instant answers now!

b ( x ) = 1 x + 3 on [ 1 , 1 + h ]

Got questions? Get instant answers now!

j ( x ) = 3 x 3 on [ 1 , 1 + h ]

3 h 2 + 9 h + 9

Got questions? Get instant answers now!

r ( t ) = 4 t 3 on [ 2 , 2 + h ]

Got questions? Get instant answers now!

f ( x + h ) f ( x ) h given f ( x ) = 2 x 2 3 x on [ x , x + h ]

4 x + 2 h 3

Got questions? Get instant answers now!

Graphical

For the following exercises, consider the graph of f shown in [link] .

Graph of a polynomial.

Estimate the average rate of change from x = 1 to x = 4.

Got questions? Get instant answers now!

Estimate the average rate of change from x = 2 to x = 5.

4 3

Got questions? Get instant answers now!

For the following exercises, use the graph of each function to estimate the intervals on which the function is increasing or decreasing.

Graph of a cubic function.

increasing on ( , 2.5 ) ( 1 , ) , decreasing on ( 2.5 ,   1 )

Got questions? Get instant answers now!
Graph of a reciprocal function.

increasing on ( , 1 ) ( 3 , 4 ) , decreasing on ( 1 , 3 ) ( 4 , )

Got questions? Get instant answers now!

For the following exercises, consider the graph shown in [link] .

Questions & Answers

what does mean opportunity cost?
Aster Reply
what is poetive effect of population growth
Solomon Reply
what is inflation
Nasir Reply
what is demand
Eleni
what is economics
IMLAN Reply
economics theory describes individual behavior as the result of a process of optimization under constraints the objective to be reached being determined by
Kalkidan
Economics is a branch of social science that deal with How to wise use of resource ,s
Kassie
need
WARKISA
Economic Needs: In economics, needs are goods or services that are necessary for maintaining a certain standard of living. This includes things like healthcare, education, and transportation.
Kalkidan
What is demand and supply
EMPEROR Reply
deman means?
Alex
what is supply?
Alex
ex play supply?
Alex
Money market is a branch or segment of financial market where short-term debt instruments are traded upon. The instruments in this market includes Treasury bills, Bonds, Commercial Papers, Call money among other.
murana Reply
good
Kayode
what is money market
umar Reply
Examine the distinction between theory of comparative cost Advantage and theory of factor proportion
Fatima Reply
What is inflation
Bright Reply
a general and ongoing rise in the level of prices in an economy
AI-Robot
What are the factors that affect demand for a commodity
Florence Reply
price
Kenu
differentiate between demand and supply giving examples
Lambiv Reply
differentiated between demand and supply using examples
Lambiv
what is labour ?
Lambiv
how will I do?
Venny Reply
how is the graph works?I don't fully understand
Rezat Reply
information
Eliyee
devaluation
Eliyee
t
WARKISA
hi guys good evening to all
Lambiv
multiple choice question
Aster Reply
appreciation
Eliyee
explain perfect market
Lindiwe Reply
In economics, a perfect market refers to a theoretical construct where all participants have perfect information, goods are homogenous, there are no barriers to entry or exit, and prices are determined solely by supply and demand. It's an idealized model used for analysis,
Ezea
Got questions? Join the online conversation and get instant answers!
Jobilize.com Reply
Practice Key Terms 9

Get Jobilize Job Search Mobile App in your pocket Now!

Get it on Google Play Download on the App Store Now


Source:  OpenStax, Algebra and trigonometry. OpenStax CNX. Nov 14, 2016 Download for free at https://legacy.cnx.org/content/col11758/1.6
Google Play and the Google Play logo are trademarks of Google Inc.

Notification Switch

Would you like to follow the 'Algebra and trigonometry' conversation and receive update notifications?

Ask