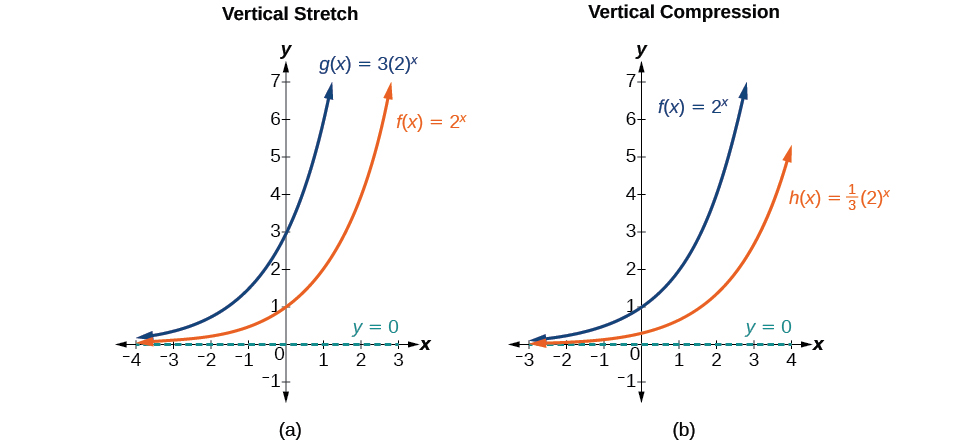
<< Chapter < Page Chapter >> Page >
Two graphs where graph a is an example of vertical stretch and graph b is an example of vertical compression.
(a) g ( x ) = 3 ( 2 ) x stretches the graph of f ( x ) = 2 x vertically by a factor of 3. (b) h ( x ) = 1 3 ( 2 ) x compresses the graph of f ( x ) = 2 x vertically by a factor of 1 3 .

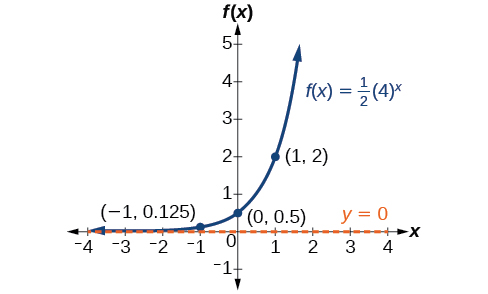
Stretches and compressions of the parent function f ( x ) = b x

For any factor a > 0 , the function f ( x ) = a ( b ) x

  • is stretched vertically by a factor of a if | a | > 1.
  • is compressed vertically by a factor of a if | a | < 1.
  • has a y -intercept of ( 0 , a ) .
  • has a horizontal asymptote at y = 0 , a range of ( 0 , ) , and a domain of ( , ) , which are unchanged from the parent function.

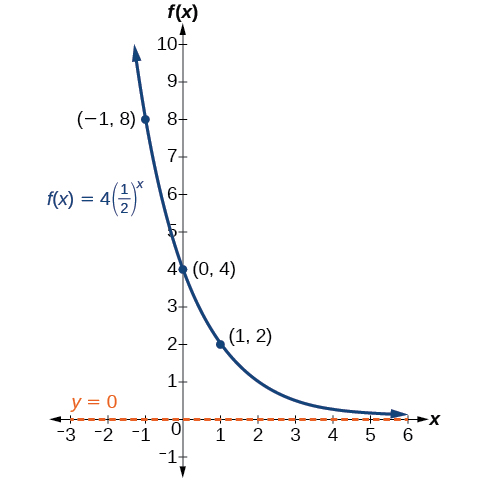
Graphing the stretch of an exponential function

Sketch a graph of f ( x ) = 4 ( 1 2 ) x . State the domain, range, and asymptote.

Before graphing, identify the behavior and key points on the graph.

  • Since b = 1 2 is between zero and one, the left tail of the graph will increase without bound as x decreases, and the right tail will approach the x -axis as x increases.
  • Since a = 4 , the graph of f ( x ) = ( 1 2 ) x will be stretched by a factor of 4.
  • Create a table of points as shown in [link] .
    x 3 2 1 0 1 2 3
    f ( x ) = 4 ( 1 2 ) x 32 16 8 4 2 1 0.5
  • Plot the y- intercept, ( 0 , 4 ) , along with two other points. We can use ( 1 , 8 ) and ( 1 , 2 ) .

Draw a smooth curve connecting the points, as shown in [link] .

Graph of the function, f(x) = 4(1/2)^(x), with an asymptote at y=0. Labeled points in the graph are (-1, 8), (0, 4), and (1, 2).

The domain is ( , ) ; the range is ( 0 , ) ; the horizontal asymptote is y = 0.

Got questions? Get instant answers now!

Sketch the graph of f ( x ) = 1 2 ( 4 ) x . State the domain, range, and asymptote.

The domain is ( , ) ; the range is ( 0 , ) ; the horizontal asymptote is y = 0.
Graph of the function, f(x) = (1/2)(4)^(x), with an asymptote at y=0. Labeled points in the graph are (-1, 0.125), (0, 0.5), and (1, 2).

Got questions? Get instant answers now!

Graphing reflections

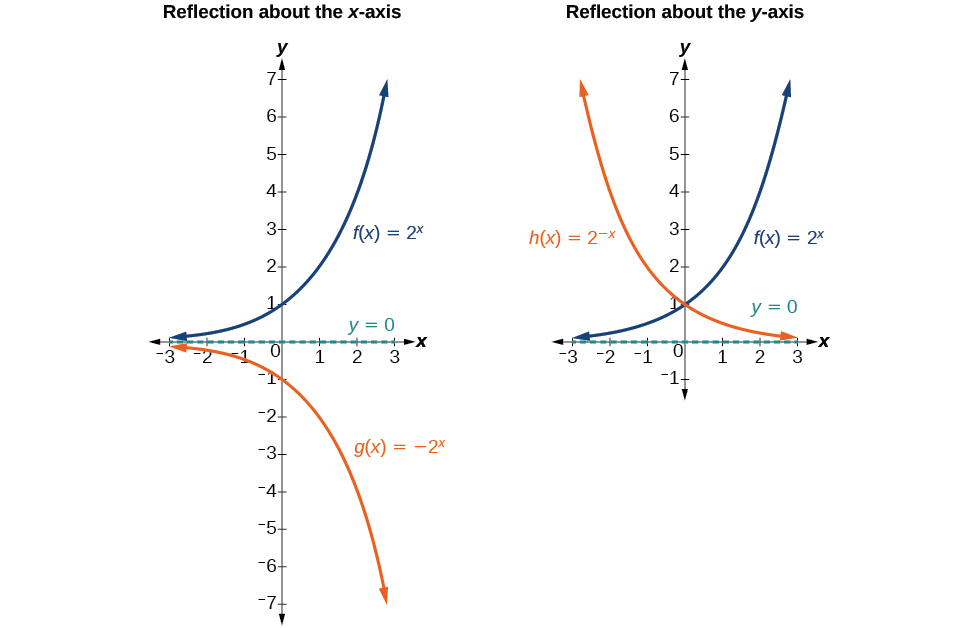
In addition to shifting, compressing, and stretching a graph, we can also reflect it about the x -axis or the y -axis. When we multiply the parent function f ( x ) = b x by −1 , we get a reflection about the x -axis. When we multiply the input by −1 , we get a reflection about the y -axis. For example, if we begin by graphing the parent function f ( x ) = 2 x , we can then graph the two reflections alongside it. The reflection about the x -axis, g ( x ) = −2 x , is shown on the left side of [link] , and the reflection about the y -axis h ( x ) = 2 x , is shown on the right side of [link] .

Two graphs where graph a is an example of a reflection about the x-axis and graph b is an example of a reflection about the y-axis.
(a) g ( x ) = 2 x reflects the graph of f ( x ) = 2 x about the x-axis. (b) g ( x ) = 2 x reflects the graph of f ( x ) = 2 x about the y -axis.

Reflections of the parent function f ( x ) = b x

The function f ( x ) = b x

  • reflects the parent function f ( x ) = b x about the x -axis.
  • has a y -intercept of ( 0 , 1 ) .
  • has a range of ( , 0 )
  • has a horizontal asymptote at y = 0 and domain of ( , ) , which are unchanged from the parent function.

The function f ( x ) = b x

  • reflects the parent function f ( x ) = b x about the y -axis.
  • has a y -intercept of ( 0 , 1 ) , a horizontal asymptote at y = 0 , a range of ( 0 , ) , and a domain of ( , ) , which are unchanged from the parent function.

Writing and graphing the reflection of an exponential function

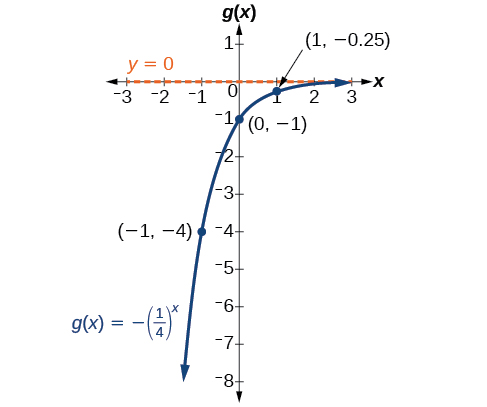
Find and graph the equation for a function, g ( x ) , that reflects f ( x ) = ( 1 4 ) x about the x -axis. State its domain, range, and asymptote.

Since we want to reflect the parent function f ( x ) = ( 1 4 ) x about the x- axis, we multiply f ( x ) by 1 to get, g ( x ) = ( 1 4 ) x . Next we create a table of points as in [link] .

x 3 2 1 0 1 2 3
g ( x ) = ( 1 4 ) x 64 16 4 1 0.25 0.0625 0.0156

Plot the y- intercept, ( 0 , −1 ) , along with two other points. We can use ( −1 , −4 ) and ( 1 , −0.25 ) .

Draw a smooth curve connecting the points:

Graph of the function, g(x) = -(0.25)^(x), with an asymptote at y=0. Labeled points in the graph are (-1, -4), (0, -1), and (1, -0.25).

The domain is ( , ) ; the range is ( , 0 ) ; the horizontal asymptote is y = 0.

Got questions? Get instant answers now!

Questions & Answers

how do you get the 2/50
Abba Reply
number of sport play by 50 student construct discrete data
Aminu Reply
width of the frangebany leaves on how to write a introduction
Theresa Reply
Solve the mean of variance
Veronica Reply
Step 1: Find the mean. To find the mean, add up all the scores, then divide them by the number of scores. ... Step 2: Find each score's deviation from the mean. ... Step 3: Square each deviation from the mean. ... Step 4: Find the sum of squares. ... Step 5: Divide the sum of squares by n – 1 or N.
kenneth
what is error
Yakuba Reply
Is mistake done to something
Vutshila
Hy
anas
hy
What is the life teble
anas
hy
Jibrin
statistics is the analyzing of data
Tajudeen Reply
what is statics?
Zelalem Reply
how do you calculate mean
Gloria Reply
diveving the sum if all values
Shaynaynay
let A1,A2 and A3 events be independent,show that (A1)^c, (A2)^c and (A3)^c are independent?
Fisaye Reply
what is statistics
Akhisani Reply
data collected all over the world
Shaynaynay
construct a less than and more than table
Imad Reply
The sample of 16 students is taken. The average age in the sample was 22 years with astandard deviation of 6 years. Construct a 95% confidence interval for the age of the population.
Aschalew Reply
Bhartdarshan' is an internet-based travel agency wherein customer can see videos of the cities they plant to visit. The number of hits daily is a normally distributed random variable with a mean of 10,000 and a standard deviation of 2,400 a. what is the probability of getting more than 12,000 hits? b. what is the probability of getting fewer than 9,000 hits?
Akshay Reply
Bhartdarshan'is an internet-based travel agency wherein customer can see videos of the cities they plan to visit. The number of hits daily is a normally distributed random variable with a mean of 10,000 and a standard deviation of 2,400. a. What is the probability of getting more than 12,000 hits
Akshay
1
Bright
Sorry i want to learn more about this question
Bright
Someone help
Bright
a= 0.20233 b=0.3384
Sufiyan
a
Shaynaynay
How do I interpret level of significance?
Mohd Reply
It depends on your business problem or in Machine Learning you could use ROC- AUC cruve to decide the threshold value
Shivam
how skewness and kurtosis are used in statistics
Owen Reply
yes what is it
Taneeya
Got questions? Join the online conversation and get instant answers!
Jobilize.com Reply

Get Jobilize Job Search Mobile App in your pocket Now!

Get it on Google Play Download on the App Store Now


Source:  OpenStax, Algebra and trigonometry. OpenStax CNX. Nov 14, 2016 Download for free at https://legacy.cnx.org/content/col11758/1.6
Google Play and the Google Play logo are trademarks of Google Inc.

Notification Switch

Would you like to follow the 'Algebra and trigonometry' conversation and receive update notifications?

Ask