Now that we have a feel for the set of values for which a logarithmic function is defined, we move on to graphing logarithmic functions. The family of logarithmic functions includes the parent function
along with all its transformations: shifts, stretches, compressions, and reflections.
We begin with the parent function
Because every logarithmic function of this form is the inverse of an exponential function with the form
their graphs will be reflections of each other across the line
To illustrate this, we can observe the relationship between the input and output values of
and its equivalent
in
[link].
Using the inputs and outputs from
[link] , we can build another table to observe the relationship between points on the graphs of the inverse functions
and
See
[link].
As we’d expect, the
x - and
y -coordinates are reversed for the inverse functions.
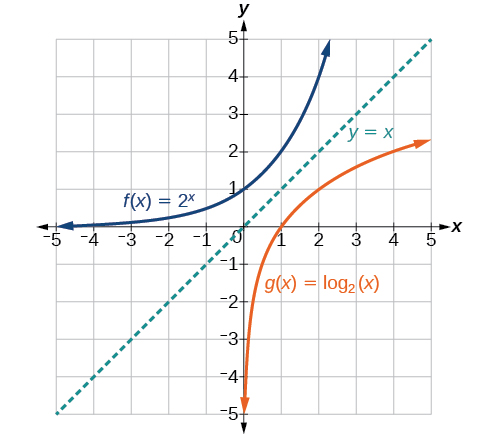
[link] shows the graph of
and
Notice that the graphs of
and
are reflections about the line
Observe the following from the graph:
has a
y -intercept at
and
has an
x - intercept at
The domain of
is the same as the range of
The range of
is the same as the domain of
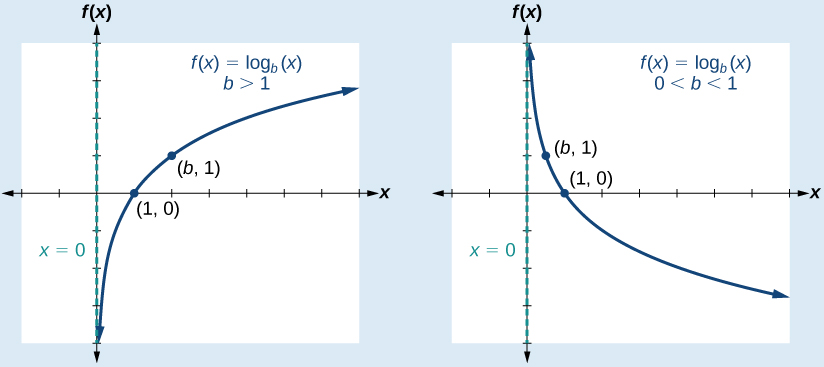
Characteristics of the graph of the parent function,
f (
x ) = log
b (
x )
For any real number
and constant
we can see the following characteristics in the graph of
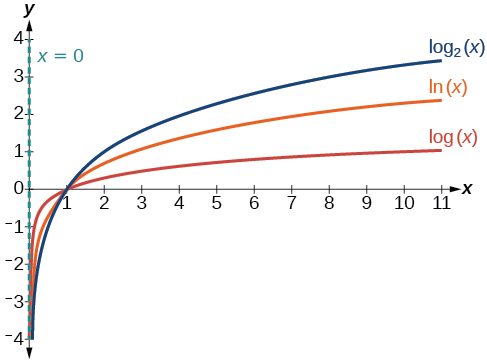
[link] shows how changing the base
in
can affect the graphs. Observe that the graphs compress vertically as the value of the base increases. (
Note: recall that the function
has base
The graphs of three logarithmic functions with different bases, all greater than 1.
is it possible to leave every good at the same level
Joseph
I don't think so. because check it, if the demand for chicken increases, people will no longer consume fish like they used to causing a fall in the demand for fish
Anuolu
is not really possible to let the value of a goods to be same at the same time.....
Salome
Suppose the inflation rate is 6%, does it mean that all the goods you purchase will cost
6% more than previous year? Provide with reasoning.
Not necessarily. To measure the inflation rate economists normally use an averaged price index of a basket of certain goods. So if you purchase goods included in the basket, you will notice that you pay 6% more, otherwise not necessarily.
Good day
How do I calculate this question: C= 100+5yd G= 2000 T= 2000 I(planned)=200.
Suppose the actual output is 3000. What is the level of planned expenditures at this level of output?
I am Camara from Guinea west Africa... happy to meet you guys here
Sekou
ma management ho
Amisha
ahile becheclor ho
Amisha
hjr ktm bta ho
ani k kaam grnu hunxa tw
Amisha
belatari
Amisha
1st year ho
Amisha
nd u
Amisha
ahh
Amisha
kaha biratnagar
Amisha
ys
Amisha
kina k vo
Amisha
money as unit of account means what?
Kalombe
A unit of account is something that can be used to value goods and services and make calculations
Jim
all of you please speak in English I can't understand you're language
Muhammad
I want to know how can we define macroeconomics in one line
Muhammad
it must be .9 or 0.9
no Mpc is greater than 1
Y=100+.9Y+50
Y-.9Y=150
0.1Y/0.1=150/0.1
Y=1500
Kalombe
Mercy is it clear?😋
Kalombe
hi can someone help me on this question
If a negative shocks shifts the IS curve to the left, what type of policy do you suggest so as to stabilize the level of output?
discuss your answer using appropriate graph.