<< Chapter < Page Chapter >> Page >
In this section, you will:
  • Identify the domain of a logarithmic function.
  • Graph logarithmic functions.

In Graphs of Exponential Functions , we saw how creating a graphical representation of an exponential model gives us another layer of insight for predicting future events. How do logarithmic graphs give us insight into situations? Because every logarithmic function is the inverse function of an exponential function, we can think of every output on a logarithmic graph as the input for the corresponding inverse exponential equation. In other words, logarithms give the cause for an effect .
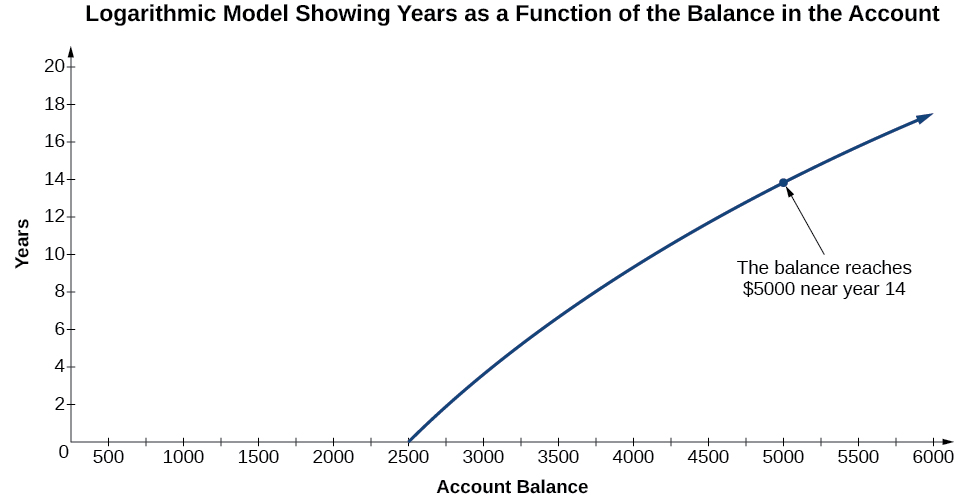
To illustrate, suppose we invest $ 2500 in an account that offers an annual interest rate of 5 % , compounded continuously. We already know that the balance in our account for any year t can be found with the equation A = 2500 e 0.05 t .

But what if we wanted to know the year for any balance? We would need to create a corresponding new function by interchanging the input and the output; thus we would need to create a logarithmic model for this situation. By graphing the model, we can see the output (year) for any input (account balance). For instance, what if we wanted to know how many years it would take for our initial investment to double? [link] shows this point on the logarithmic graph.

A graph titled, “Logarithmic Model Showing Years as a Function of the Balance in the Account”. The x-axis is labeled, “Account Balance”, and the y-axis is labeled, “Years”. The line starts at $25,000 on the first year. The graph also notes that the balance reaches $5,000 near year 14.

In this section we will discuss the values for which a logarithmic function is defined, and then turn our attention to graphing the family of logarithmic functions.

Finding the domain of a logarithmic function

Before working with graphs, we will take a look at the domain (the set of input values) for which the logarithmic function is defined.

Recall that the exponential function is defined as y = b x for any real number x and constant b > 0 , b 1 , where

  • The domain of y is ( , ) .
  • The range of y is ( 0 , ) .

In the last section we learned that the logarithmic function y = log b ( x ) is the inverse of the exponential function y = b x . So, as inverse functions:

  • The domain of y = log b ( x ) is the range of y = b x : ( 0 , ) .
  • The range of y = log b ( x ) is the domain of y = b x : ( , ) .

Transformations of the parent function y = log b ( x ) behave similarly to those of other functions. Just as with other parent functions, we can apply the four types of transformations—shifts, stretches, compressions, and reflections—to the parent function without loss of shape.

In Graphs of Exponential Functions we saw that certain transformations can change the range of y = b x . Similarly, applying transformations to the parent function y = log b ( x ) can change the domain . When finding the domain of a logarithmic function, therefore, it is important to remember that the domain consists only of positive real numbers . That is, the argument of the logarithmic function must be greater than zero.

For example, consider f ( x ) = log 4 ( 2 x 3 ) . This function is defined for any values of x such that the argument, in this case 2 x 3 , is greater than zero. To find the domain, we set up an inequality and solve for x :

2 x 3 > 0 Show the argument greater than zero . 2 x > 3 Add 3 . x > 1.5 Divide by 2 .

In interval notation, the domain of f ( x ) = log 4 ( 2 x 3 ) is ( 1.5 , ) .

Questions & Answers

what does mean opportunity cost?
Aster Reply
what is poetive effect of population growth
Solomon Reply
what is inflation
Nasir Reply
what is demand
Eleni
what is economics
IMLAN Reply
economics theory describes individual behavior as the result of a process of optimization under constraints the objective to be reached being determined by
Kalkidan
Economics is a branch of social science that deal with How to wise use of resource ,s
Kassie
need
WARKISA
Economic Needs: In economics, needs are goods or services that are necessary for maintaining a certain standard of living. This includes things like healthcare, education, and transportation.
Kalkidan
What is demand and supply
EMPEROR Reply
deman means?
Alex
what is supply?
Alex
ex play supply?
Alex
Money market is a branch or segment of financial market where short-term debt instruments are traded upon. The instruments in this market includes Treasury bills, Bonds, Commercial Papers, Call money among other.
murana Reply
good
Kayode
what is money market
umar Reply
Examine the distinction between theory of comparative cost Advantage and theory of factor proportion
Fatima Reply
What is inflation
Bright Reply
a general and ongoing rise in the level of prices in an economy
AI-Robot
What are the factors that affect demand for a commodity
Florence Reply
price
Kenu
differentiate between demand and supply giving examples
Lambiv Reply
differentiated between demand and supply using examples
Lambiv
what is labour ?
Lambiv
how will I do?
Venny Reply
how is the graph works?I don't fully understand
Rezat Reply
information
Eliyee
devaluation
Eliyee
t
WARKISA
hi guys good evening to all
Lambiv
multiple choice question
Aster Reply
appreciation
Eliyee
explain perfect market
Lindiwe Reply
In economics, a perfect market refers to a theoretical construct where all participants have perfect information, goods are homogenous, there are no barriers to entry or exit, and prices are determined solely by supply and demand. It's an idealized model used for analysis,
Ezea
Got questions? Join the online conversation and get instant answers!
Jobilize.com Reply

Get Jobilize Job Search Mobile App in your pocket Now!

Get it on Google Play Download on the App Store Now


Source:  OpenStax, Algebra and trigonometry. OpenStax CNX. Nov 14, 2016 Download for free at https://legacy.cnx.org/content/col11758/1.6
Google Play and the Google Play logo are trademarks of Google Inc.

Notification Switch

Would you like to follow the 'Algebra and trigonometry' conversation and receive update notifications?

Ask