<< Chapter < Page Chapter >> Page >
A graph of sin(x) that shows that sin(x) is an odd function due to the odd symmetry of the graph.
Odd symmetry of the sine function

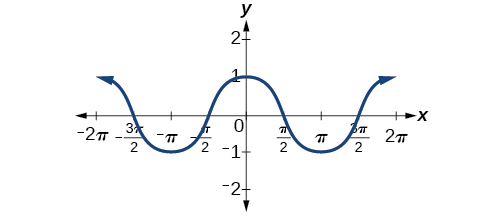
[link] shows that the cosine function is symmetric about the y -axis. Again, we determined that the cosine function is an even function. Now we can see from the graph that cos ( x ) = cos   x .

A graph of cos(x) that shows that cos(x) is an even function due to the even symmetry of the graph.
Even symmetry of the cosine function

Characteristics of sine and cosine functions

The sine and cosine functions have several distinct characteristics:

  • They are periodic functions with a period of 2 π .
  • The domain of each function is ( , ) and the range is [ 1 , 1 ] .
  • The graph of y = sin   x is symmetric about the origin, because it is an odd function.
  • The graph of y = cos   x is symmetric about the y - axis, because it is an even function.

Investigating sinusoidal functions

As we can see, sine and cosine functions have a regular period and range. If we watch ocean waves or ripples on a pond, we will see that they resemble the sine or cosine functions. However, they are not necessarily identical. Some are taller or longer than others. A function that has the same general shape as a sine or cosine function    is known as a sinusoidal function    . The general forms of sinusoidal functions are

y = A sin ( B x C ) + D               and y = A cos ( B x C ) + D

Determining the period of sinusoidal functions

Looking at the forms of sinusoidal functions, we can see that they are transformations of the sine and cosine functions. We can use what we know about transformations to determine the period.
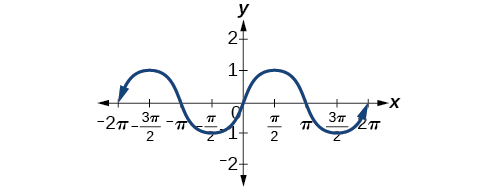
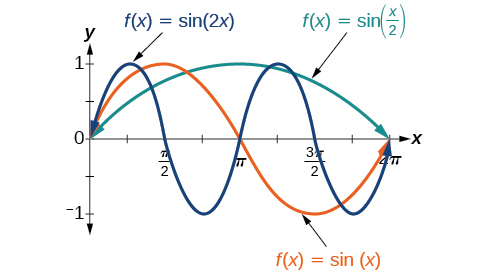
In the general formula, B is related to the period by P = 2 π | B | . If | B | > 1 , then the period is less than 2 π and the function undergoes a horizontal compression, whereas if | B | < 1 , then the period is greater than 2 π and the function undergoes a horizontal stretch. For example, f ( x ) = sin ( x ), B = 1, so the period is 2 π , which we knew. If f ( x ) = sin ( 2 x ) , then B = 2, so the period is π and the graph is compressed. If f ( x ) = sin ( x 2 ) , then B = 1 2 , so the period is 4 π and the graph is stretched. Notice in [link] how the period is indirectly related to | B | .

A graph with three items. The x-axis ranges from 0 to 2pi. The y-axis ranges from -1 to 1. The first item is the graph of sin(x) for one full period. The second is the graph of sin(2x) over two periods. The third is the graph of sin(x/2) for one half of a period.

Period of sinusoidal functions

If we let C = 0 and D = 0 in the general form equations of the sine and cosine functions, we obtain the forms

y = A sin ( B x )
y = A cos ( B x )

The period is 2 π | B | .

Identifying the period of a sine or cosine function

Determine the period of the function f ( x ) = sin ( π 6 x ) .

Let’s begin by comparing the equation to the general form y = A sin ( B x ) .

In the given equation, B = π 6 , so the period will be

P = 2 π | B |    = 2 π π 6    = 2 π 6 π    = 12
Got questions? Get instant answers now!

Determine the period of the function g ( x ) = cos ( x 3 ) .

6 π

Got questions? Get instant answers now!

Determining amplitude

Returning to the general formula for a sinusoidal function, we have analyzed how the variable B relates to the period. Now let’s turn to the variable A so we can analyze how it is related to the amplitude , or greatest distance from rest. A represents the vertical stretch factor, and its absolute value | A | is the amplitude. The local maxima will be a distance | A | above the vertical midline of the graph, which is the line x = D ; because D = 0 in this case, the midline is the x -axis. The local minima will be the same distance below the midline. If | A | > 1 , the function is stretched. For example, the amplitude of f ( x ) = 4 sin x is twice the amplitude of f ( x ) = 2 sin x . If | A | < 1 , the function is compressed. [link] compares several sine functions with different amplitudes.

Questions & Answers

how do you get the 2/50
Abba Reply
number of sport play by 50 student construct discrete data
Aminu Reply
width of the frangebany leaves on how to write a introduction
Theresa Reply
Solve the mean of variance
Veronica Reply
Step 1: Find the mean. To find the mean, add up all the scores, then divide them by the number of scores. ... Step 2: Find each score's deviation from the mean. ... Step 3: Square each deviation from the mean. ... Step 4: Find the sum of squares. ... Step 5: Divide the sum of squares by n – 1 or N.
kenneth
what is error
Yakuba Reply
Is mistake done to something
Vutshila
Hy
anas
hy
What is the life teble
anas
hy
Jibrin
statistics is the analyzing of data
Tajudeen Reply
what is statics?
Zelalem Reply
how do you calculate mean
Gloria Reply
diveving the sum if all values
Shaynaynay
let A1,A2 and A3 events be independent,show that (A1)^c, (A2)^c and (A3)^c are independent?
Fisaye Reply
what is statistics
Akhisani Reply
data collected all over the world
Shaynaynay
construct a less than and more than table
Imad Reply
The sample of 16 students is taken. The average age in the sample was 22 years with astandard deviation of 6 years. Construct a 95% confidence interval for the age of the population.
Aschalew Reply
Bhartdarshan' is an internet-based travel agency wherein customer can see videos of the cities they plant to visit. The number of hits daily is a normally distributed random variable with a mean of 10,000 and a standard deviation of 2,400 a. what is the probability of getting more than 12,000 hits? b. what is the probability of getting fewer than 9,000 hits?
Akshay Reply
Bhartdarshan'is an internet-based travel agency wherein customer can see videos of the cities they plan to visit. The number of hits daily is a normally distributed random variable with a mean of 10,000 and a standard deviation of 2,400. a. What is the probability of getting more than 12,000 hits
Akshay
1
Bright
Sorry i want to learn more about this question
Bright
Someone help
Bright
a= 0.20233 b=0.3384
Sufiyan
a
Shaynaynay
How do I interpret level of significance?
Mohd Reply
It depends on your business problem or in Machine Learning you could use ROC- AUC cruve to decide the threshold value
Shivam
how skewness and kurtosis are used in statistics
Owen Reply
yes what is it
Taneeya
Got questions? Join the online conversation and get instant answers!
Jobilize.com Reply
Practice Key Terms 5

Get Jobilize Job Search Mobile App in your pocket Now!

Get it on Google Play Download on the App Store Now


Source:  OpenStax, Algebra and trigonometry. OpenStax CNX. Nov 14, 2016 Download for free at https://legacy.cnx.org/content/col11758/1.6
Google Play and the Google Play logo are trademarks of Google Inc.

Notification Switch

Would you like to follow the 'Algebra and trigonometry' conversation and receive update notifications?

Ask