<< Chapter < Page Chapter >> Page >

Find an equation for the exponential function graphed in [link] .

Graph of an increasing function with a labeled point at (0, sqrt(2)).

f ( x ) = 2 ( 2 ) x . 
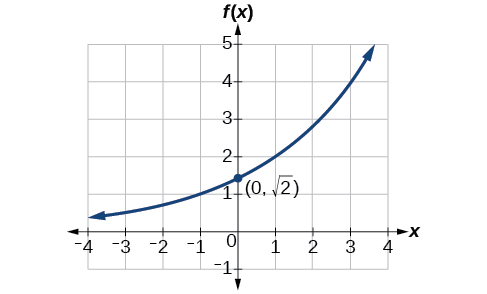
Answers may vary due to round-off error. The answer should be very close to 1.4142 ( 1.4142 ) x .

Got questions? Get instant answers now!

Given two points on the curve of an exponential function, use a graphing calculator to find the equation.

  1. Press [STAT].
  2. Clear any existing entries in columns L1 or L2.
  3. In L1 , enter the x -coordinates given.
  4. In L2 , enter the corresponding y -coordinates.
  5. Press [STAT] again. Cursor right to CALC , scroll down to ExpReg (Exponential Regression) , and press [ENTER].
  6. The screen displays the values of a and b in the exponential equation y = a b x .

Using a graphing calculator to find an exponential function

Use a graphing calculator to find the exponential equation that includes the points ( 2 , 24.8 ) and ( 5 , 198.4 ) .

Follow the guidelines above. First press [STAT] , [EDIT] , [1: Edit…], and clear the lists L1 and L2 . Next, in the L1 column, enter the x -coordinates, 2 and 5. Do the same in the L2 column for the y -coordinates, 24.8 and 198.4.

Now press [STAT] , [CALC] , [0: ExpReg] and press [ENTER] . The values a = 6.2 and b = 2 will be displayed. The exponential equation is y = 6.2 2 x .

Got questions? Get instant answers now!

Use a graphing calculator to find the exponential equation that includes the points (3, 75.98) and (6, 481.07).

y 12 1.85 x

Got questions? Get instant answers now!

Applying the compound-interest formula

Savings instruments in which earnings are continually reinvested, such as mutual funds and retirement accounts, use compound interest    . The term compounding refers to interest earned not only on the original value, but on the accumulated value of the account.

The annual percentage rate (APR)    of an account, also called the nominal rate    , is the yearly interest rate earned by an investment account. The term  nominal  is used when the compounding occurs a number of times other than once per year. In fact, when interest is compounded more than once a year, the effective interest rate ends up being greater than the nominal rate! This is a powerful tool for investing.

We can calculate the compound interest using the compound interest formula, which is an exponential function of the variables time t , principal P , APR r , and number of compounding periods in a year n :

A ( t ) = P ( 1 + r n ) n t

For example, observe [link] , which shows the result of investing $1,000 at 10% for one year. Notice how the value of the account increases as the compounding frequency increases.

Frequency Value after 1 year
Annually $1100
Semiannually $1102.50
Quarterly $1103.81
Monthly $1104.71
Daily $1105.16

The compound interest formula

Compound interest can be calculated using the formula

A ( t ) = P ( 1 + r n ) n t

where

  • A ( t ) is the account value,
  • t is measured in years,
  • P is the starting amount of the account, often called the principal, or more generally present value,
  • r is the annual percentage rate (APR) expressed as a decimal, and
  • n is the number of compounding periods in one year.

Calculating compound interest

If we invest $3,000 in an investment account paying 3% interest compounded quarterly, how much will the account be worth in 10 years?

Because we are starting with $3,000, P = 3000. Our interest rate is 3%, so r   =   0.03. Because we are compounding quarterly, we are compounding 4 times per year, so n = 4. We want to know the value of the account in 10 years, so we are looking for A ( 10 ) , the value when t   =   10.

A ( t ) = P ( 1 + r n ) n t Use the compound interest formula . A ( 10 ) = 3000 ( 1 + 0.03 4 ) 4⋅10 Substitute using given values . $ 4045.05 Round to two decimal places .

The account will be worth about $4,045.05 in 10 years.

Got questions? Get instant answers now!

Questions & Answers

how do you get the 2/50
Abba Reply
number of sport play by 50 student construct discrete data
Aminu Reply
width of the frangebany leaves on how to write a introduction
Theresa Reply
Solve the mean of variance
Veronica Reply
Step 1: Find the mean. To find the mean, add up all the scores, then divide them by the number of scores. ... Step 2: Find each score's deviation from the mean. ... Step 3: Square each deviation from the mean. ... Step 4: Find the sum of squares. ... Step 5: Divide the sum of squares by n – 1 or N.
kenneth
what is error
Yakuba Reply
Is mistake done to something
Vutshila
Hy
anas
hy
What is the life teble
anas
hy
Jibrin
statistics is the analyzing of data
Tajudeen Reply
what is statics?
Zelalem Reply
how do you calculate mean
Gloria Reply
diveving the sum if all values
Shaynaynay
let A1,A2 and A3 events be independent,show that (A1)^c, (A2)^c and (A3)^c are independent?
Fisaye Reply
what is statistics
Akhisani Reply
data collected all over the world
Shaynaynay
construct a less than and more than table
Imad Reply
The sample of 16 students is taken. The average age in the sample was 22 years with astandard deviation of 6 years. Construct a 95% confidence interval for the age of the population.
Aschalew Reply
Bhartdarshan' is an internet-based travel agency wherein customer can see videos of the cities they plant to visit. The number of hits daily is a normally distributed random variable with a mean of 10,000 and a standard deviation of 2,400 a. what is the probability of getting more than 12,000 hits? b. what is the probability of getting fewer than 9,000 hits?
Akshay Reply
Bhartdarshan'is an internet-based travel agency wherein customer can see videos of the cities they plan to visit. The number of hits daily is a normally distributed random variable with a mean of 10,000 and a standard deviation of 2,400. a. What is the probability of getting more than 12,000 hits
Akshay
1
Bright
Sorry i want to learn more about this question
Bright
Someone help
Bright
a= 0.20233 b=0.3384
Sufiyan
a
Shaynaynay
How do I interpret level of significance?
Mohd Reply
It depends on your business problem or in Machine Learning you could use ROC- AUC cruve to decide the threshold value
Shivam
how skewness and kurtosis are used in statistics
Owen Reply
yes what is it
Taneeya
Got questions? Join the online conversation and get instant answers!
Jobilize.com Reply
Practice Key Terms 4

Get Jobilize Job Search Mobile App in your pocket Now!

Get it on Google Play Download on the App Store Now


Source:  OpenStax, Algebra and trigonometry. OpenStax CNX. Nov 14, 2016 Download for free at https://legacy.cnx.org/content/col11758/1.6
Google Play and the Google Play logo are trademarks of Google Inc.

Notification Switch

Would you like to follow the 'Algebra and trigonometry' conversation and receive update notifications?

Ask