<< Chapter < Page Chapter >> Page >

Finding increasing and decreasing intervals on a graph

Given the function p ( t ) in [link] , identify the intervals on which the function appears to be increasing.
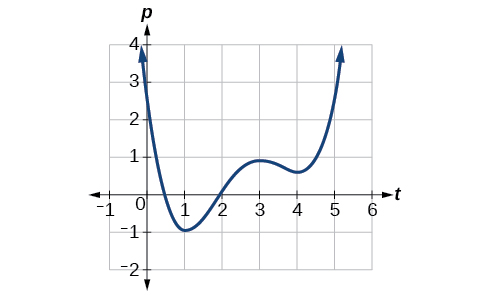
Graph of a polynomial.

We see that the function is not constant on any interval. The function is increasing where it slants upward as we move to the right and decreasing where it slants downward as we move to the right. The function appears to be increasing from t = 1 to t = 3 and from t = 4 on.

In interval notation    , we would say the function appears to be increasing on the interval (1,3) and the interval ( 4 , ) .

Got questions? Get instant answers now!

Finding local extrema from a graph

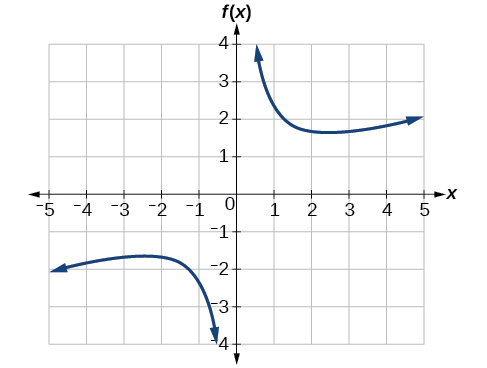
Graph the function f ( x ) = 2 x + x 3 . Then use the graph to estimate the local extrema of the function and to determine the intervals on which the function is increasing.

Using technology, we find that the graph of the function looks like that in [link] . It appears there is a low point, or local minimum, between x = 2 and x = 3 , and a mirror-image high point, or local maximum, somewhere between x = −3 and x = −2.

Graph of a reciprocal function.
Got questions? Get instant answers now!

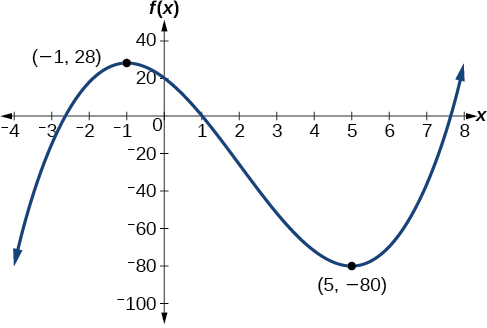
Graph the function f ( x ) = x 3 6 x 2 15 x + 20 to estimate the local extrema of the function. Use these to determine the intervals on which the function is increasing and decreasing.

The local maximum appears to occur at ( 1 , 28 ) , and the local minimum occurs at ( 5 , 80 ) . The function is increasing on ( , 1 ) ( 5 , ) and decreasing on ( 1 , 5 ) .

Graph of a polynomial with a local maximum at (-1, 28) and local minimum at (5, -80).
Got questions? Get instant answers now!

Finding local maxima and minima from a graph

For the function f whose graph is shown in [link] , find all local maxima and minima.
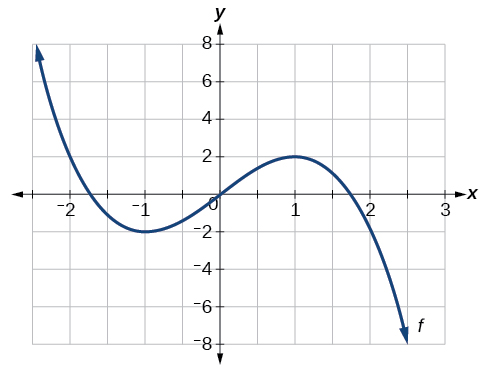
Graph of a polynomial.

Observe the graph of f . The graph attains a local maximum at x = 1 because it is the highest point in an open interval around x = 1. The local maximum is the y -coordinate at x = 1 , which is 2.

The graph attains a local minimum at   x = −1   because it is the lowest point in an open interval around x = −1. The local minimum is the y -coordinate at x = −1 , which is −2.

Got questions? Get instant answers now!

Analyzing the toolkit functions for increasing or decreasing intervals

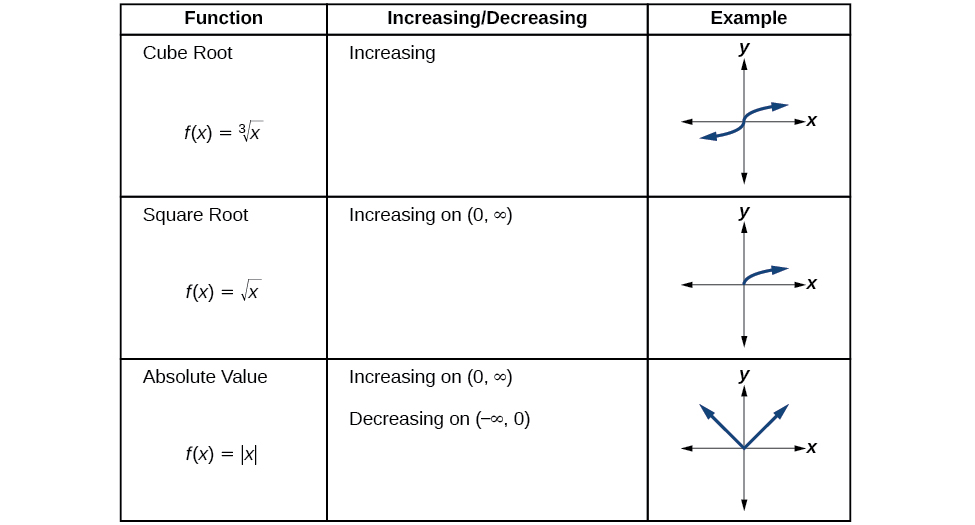
We will now return to our toolkit functions and discuss their graphical behavior in [link] , [link] , and [link] .
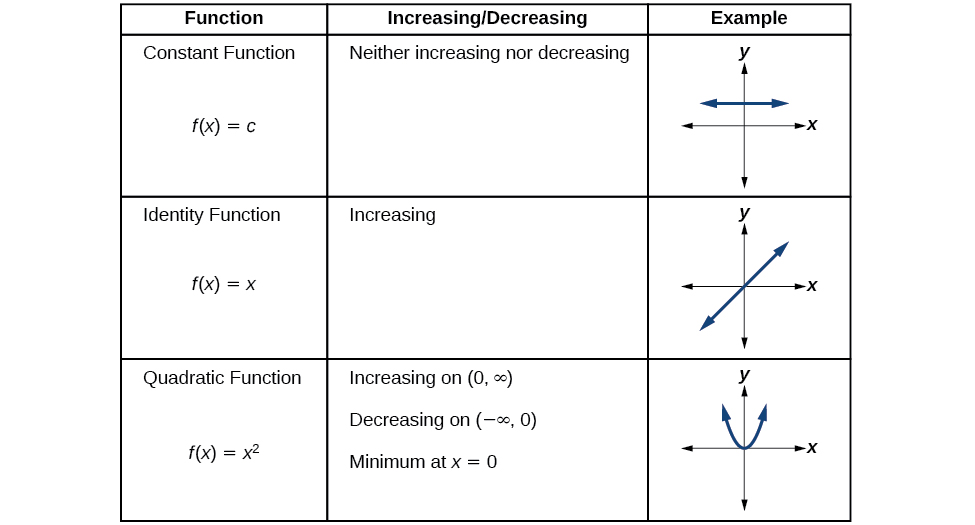
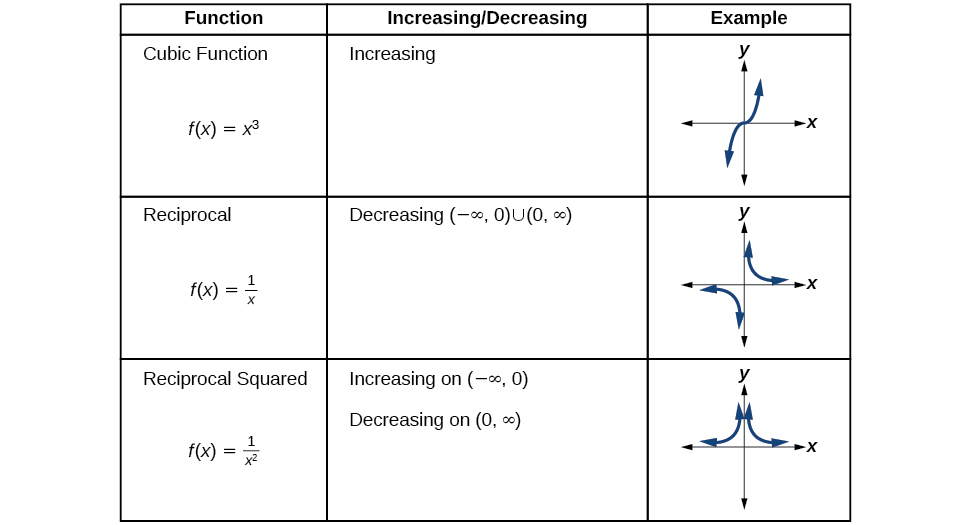
Table showing the increasing and decreasing intervals of the toolkit functions.

Use a graph to locate the absolute maximum and absolute minimum

There is a difference between locating the highest and lowest points on a graph in a region around an open interval (locally) and locating the highest and lowest points on the graph for the entire domain. The y - coordinates (output) at the highest and lowest points are called the absolute maximum and absolute minimum , respectively.

To locate absolute maxima and minima from a graph, we need to observe the graph to determine where the graph attains it highest and lowest points on the domain of the function. See [link] .
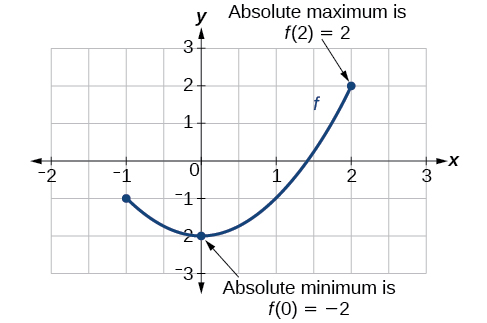
Graph of a segment of a parabola with an absolute minimum at (0, -2) and absolute maximum at (2, 2).

Not every function has an absolute maximum or minimum value. The toolkit function f ( x ) = x 3 is one such function.

Absolute maxima and minima

The absolute maximum    of f at x = c is f ( c ) where f ( c ) f ( x ) for all x in the domain of f .

The absolute minimum    of f at x = d is f ( d ) where f ( d ) f ( x ) for all x in the domain of f .

Finding absolute maxima and minima from a graph

For the function f shown in [link] , find all absolute maxima and minima.
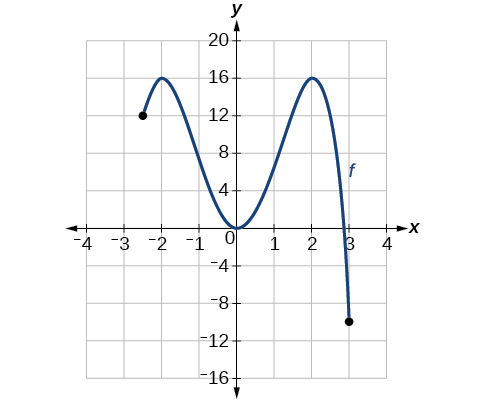
Graph of a polynomial.

Observe the graph of f . The graph attains an absolute maximum in two locations, x = −2 and x = 2 , because at these locations, the graph attains its highest point on the domain of the function. The absolute maximum is the y -coordinate at x = −2 and x = 2 , which is 16.

The graph attains an absolute minimum at x = 3 , because it is the lowest point on the domain of the function’s graph. The absolute minimum is the y -coordinate at x = 3 , which is −10.

Got questions? Get instant answers now!

Questions & Answers

Why is b in the answer
Dahsolar Reply
how do you work it out?
Brad Reply
answer
Ernest
heheheehe
Nitin
(Pcos∅+qsin∅)/(pcos∅-psin∅)
John Reply
how to do that?
Rosemary Reply
what is it about?
Amoah
how to answer the activity
Chabelita Reply
how to solve the activity
Chabelita
solve for X,,4^X-6(2^)-16=0
Alieu Reply
x4xminus 2
Lominate
sobhan Singh jina uniwarcity tignomatry ka long answers tile questions
harish Reply
t he silly nut company makes two mixtures of nuts: mixture a and mixture b. a pound of mixture a contains 12 oz of peanuts, 3 oz of almonds and 1 oz of cashews and sells for $4. a pound of mixture b contains 12 oz of peanuts, 2 oz of almonds and 2 oz of cashews and sells for $5. the company has 1080
ZAHRO Reply
If  , , are the roots of the equation 3 2 0, x px qx r     Find the value of 1  .
Swetha Reply
Parts of a pole were painted red, blue and yellow. 3/5 of the pole was red and 7/8 was painted blue. What part was painted yellow?
Patrick Reply
Parts of the pole was painted red, blue and yellow. 3 /5 of the pole was red and 7 /8 was painted blue. What part was painted yellow?
Patrick
how I can simplify algebraic expressions
Katleho Reply
Lairene and Mae are joking that their combined ages equal Sam’s age. If Lairene is twice Mae’s age and Sam is 69 yrs old, what are Lairene’s and Mae’s ages?
Mary Reply
23yrs
Yeboah
lairenea's age is 23yrs
ACKA
hy
Katleho
Ello everyone
Katleho
Laurene is 46 yrs and Mae is 23 is
Solomon
hey people
christopher
age does not matter
christopher
solve for X, 4^x-6(2*)-16=0
Alieu
prove`x^3-3x-2cosA=0 (-π<A<=π
Mayank Reply
create a lesson plan about this lesson
Rose Reply
Excusme but what are you wrot?
Practice Key Terms 9

Get Jobilize Job Search Mobile App in your pocket Now!

Get it on Google Play Download on the App Store Now


Source:  OpenStax, Algebra and trigonometry. OpenStax CNX. Nov 14, 2016 Download for free at https://legacy.cnx.org/content/col11758/1.6
Google Play and the Google Play logo are trademarks of Google Inc.

Notification Switch

Would you like to follow the 'Algebra and trigonometry' conversation and receive update notifications?

Ask