Finding increasing and decreasing intervals on a graph
Given the function
in
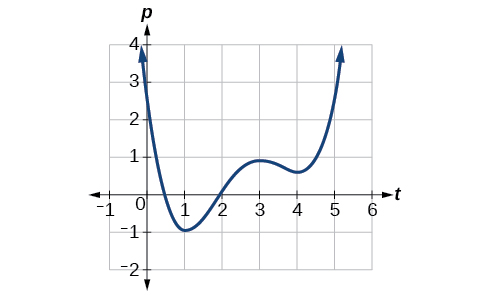
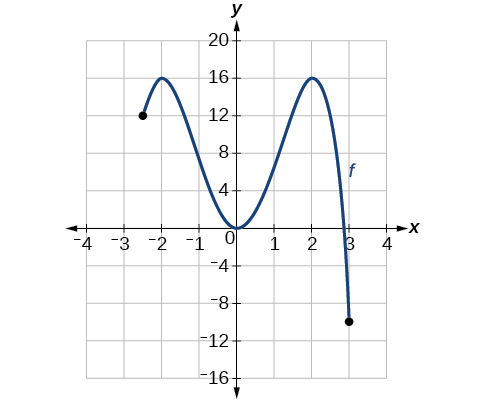
[link] , identify the intervals on which the function appears to be increasing.
We see that the function is not constant on any interval. The function is increasing where it slants upward as we move to the right and decreasing where it slants downward as we move to the right. The function appears to be increasing from
to
and from
on.
In
interval notation , we would say the function appears to be increasing on the interval (1,3) and the interval
Graph the function
Then use the graph to estimate the local extrema of the function and to determine the intervals on which the function is increasing.
Using technology, we find that the graph of the function looks like that in
[link] . It appears there is a low point, or local minimum, between
and
and a mirror-image high point, or local maximum, somewhere between
and
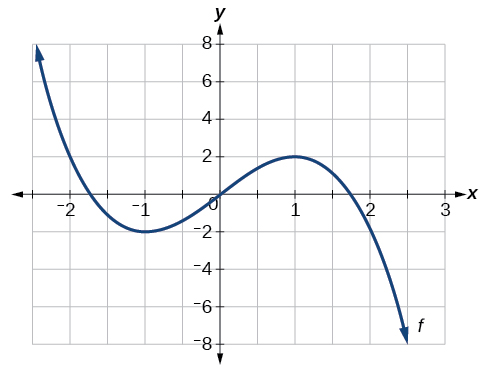
Graph the function
to estimate the local extrema of the function. Use these to determine the intervals on which the function is increasing and decreasing.
The local maximum appears to occur at
and the local minimum occurs at
The function is increasing on
and decreasing on
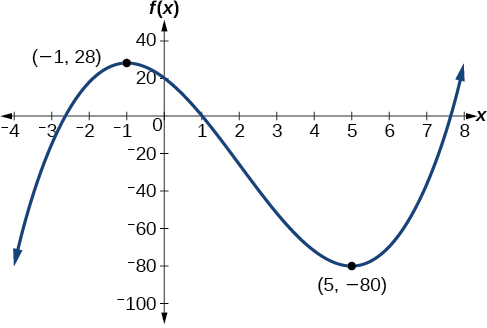
For the function
whose graph is shown in
[link] , find all local maxima and minima.
Observe the graph of
The graph attains a local maximum at
because it is the highest point in an open interval around
The local maximum is the
-coordinate at
which is
The graph attains a local minimum at
because it is the lowest point in an open interval around
The local minimum is the
y -coordinate at
which is
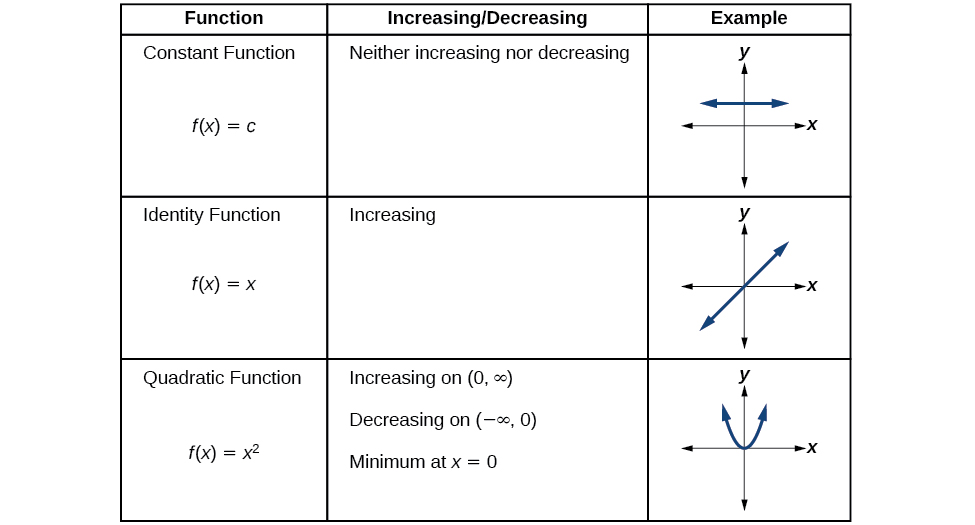
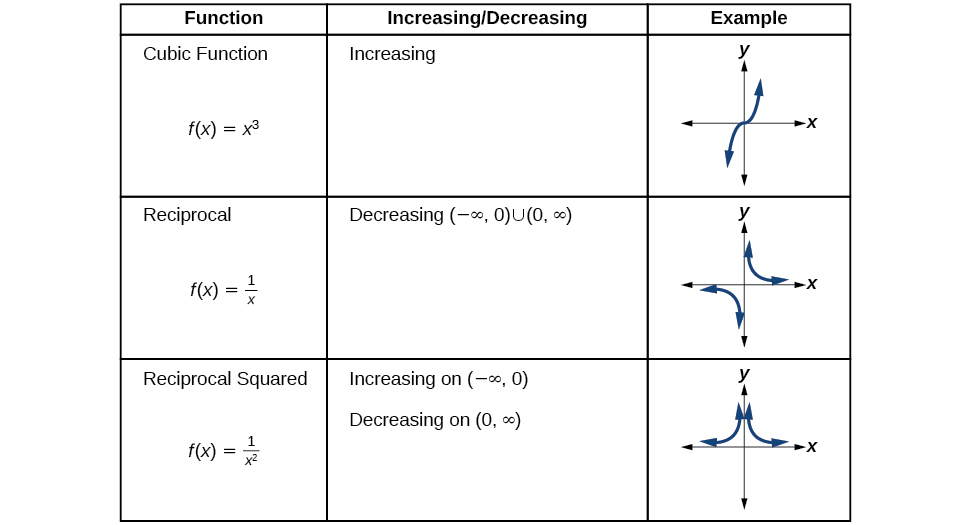
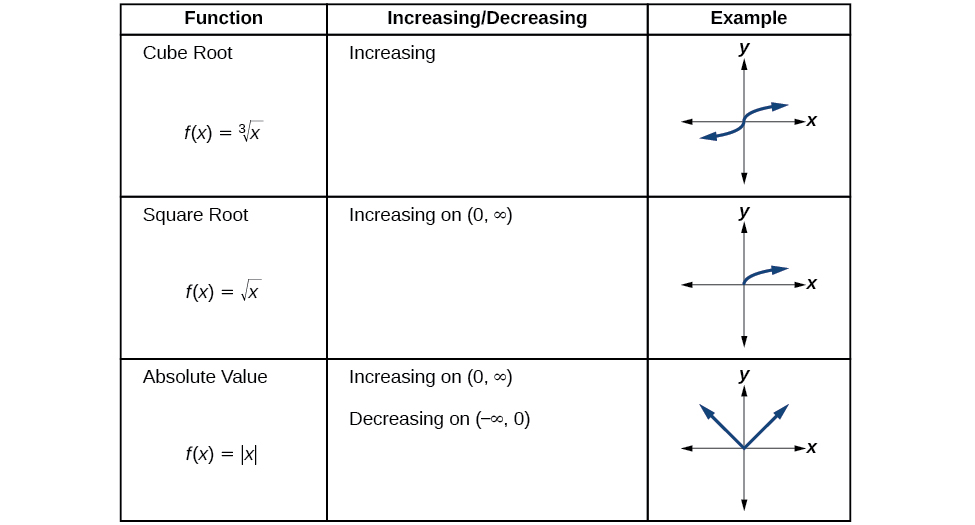
Analyzing the toolkit functions for increasing or decreasing intervals
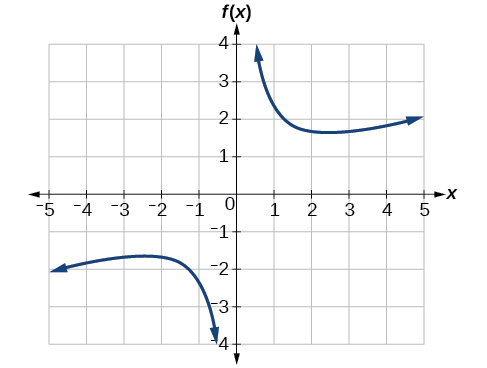
We will now return to our toolkit functions and discuss their graphical behavior in
[link] ,
[link] , and
[link] .
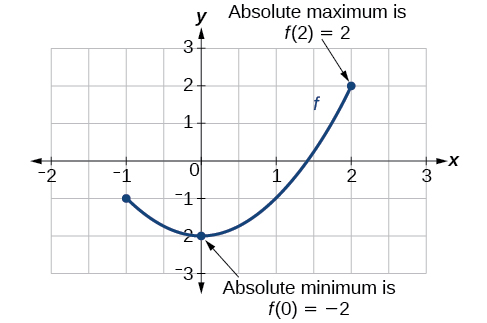
Use a graph to locate the absolute maximum and absolute minimum
There is a difference between locating the highest and lowest points on a graph in a region around an open interval (locally) and locating the highest and lowest points on the graph for the entire domain. The
coordinates (output) at the highest and lowest points are called the
absolute maximum and
absolute minimum , respectively.
To locate absolute maxima and minima from a graph, we need to observe the graph to determine where the graph attains it highest and lowest points on the domain of the function. See
[link] .
Not every function has an absolute maximum or minimum value. The toolkit function
is one such function.
Absolute maxima and minima
The
absolute maximum of
at
is
where
for all
in the domain of
The
absolute minimum of
at
is
where
for all
in the domain of
Finding absolute maxima and minima from a graph
For the function
shown in
[link] , find all absolute maxima and minima.
Observe the graph of
The graph attains an absolute maximum in two locations,
and
because at these locations, the graph attains its highest point on the domain of the function. The absolute maximum is the
y -coordinate at
and
which is
The graph attains an absolute minimum at
because it is the lowest point on the domain of the function’s graph. The absolute minimum is the
y -coordinate at
which is
Astronomy (from Ancient Greek ἀστρονομία (astronomía) 'science that studies the laws of the stars') is a natural science that studies celestial objects and phenomena. It uses mathematics, physics, and chemistry in order to explain their origin and evolution.
Rafael
vjuvu
Elgoog
what is big bang theory?
Rosemary
what type of activity astronomer do?
Rosemary
No
Richard
the big bang theory is a theory which states that all matter was compressed together in one place the matter got so unstable it exploded releasing All its contents in the form of hydrogen
according to the theory of astronomers why the moon is always appear in an elliptical orbit?
Gatjuol
hi !!! I am new in astronomy....
I have so many questions in mind ....
all of scientists of the word they just give opinion only.
but they never think true or false ...
i respect all of them...
I believes whole universe depending
on true ...থিউরি
Govinda
hello
Jackson
hi
Elyana
we're all stars and galaxies a part of sun. how can science prove thx with respect old ancient times picture or books..or anything with respect to present time .but we r a part of that universe
there many theory to born universe but what is the reality of big bang theory to born universe
Asmit
what is the exact value of π?
Nagalakshmi
by big bang
universal
there are many theories regarding this it's on you believe any theory that you think is true ex. eternal inflation theory, oscillation model theory, multiple universe theory the big bang theory etc.
Aarya
I think after Big Bang!
Michele
from where on earth could u observe all the stars during the during the course of an year
is that so. the question was in the end of this chapter
Karuna
in theory, you could see them all from the equator (though over the course of a year, not at pne time). stars are measured in "declination", which is how far N or S of the equator (90* to -90*). Polaris is the North star, and is ALMOST 90* (+89*).
So it would just barely creep over the horizon.
Christopher
Got questions? Join the online conversation and get instant answers!