<< Chapter < Page Chapter >> Page >
In this section, you will:
  • Recognize characteristics of parabolas.
  • Understand how the graph of a parabola is related to its quadratic function.
  • Determine a quadratic function’s minimum or maximum value.
  • Solve problems involving a quadratic function’s minimum or maximum value.
Satellite dishes.
An array of satellite dishes. (credit: Matthew Colvin de Valle, Flickr)

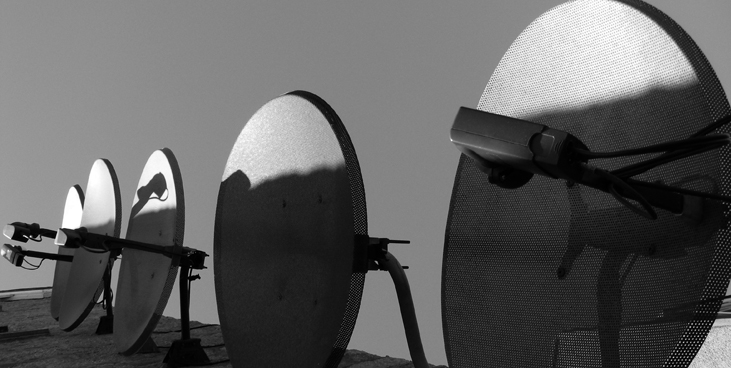
Curved antennas, such as the ones shown in [link] , are commonly used to focus microwaves and radio waves to transmit television and telephone signals, as well as satellite and spacecraft communication. The cross-section of the antenna is in the shape of a parabola, which can be described by a quadratic function.

In this section, we will investigate quadratic functions, which frequently model problems involving area and projectile motion. Working with quadratic functions can be less complex than working with higher degree functions, so they provide a good opportunity for a detailed study of function behavior.

Recognizing characteristics of parabolas

The graph of a quadratic function is a U-shaped curve called a parabola . One important feature of the graph is that it has an extreme point, called the vertex    . If the parabola opens up, the vertex represents the lowest point on the graph, or the minimum value of the quadratic function. If the parabola opens down, the vertex represents the highest point on the graph, or the maximum value . In either case, the vertex is a turning point on the graph. The graph is also symmetric with a vertical line drawn through the vertex, called the axis of symmetry    . These features are illustrated in [link] .

Graph of a parabola showing where the x and y intercepts, vertex, and axis of symmetry are.

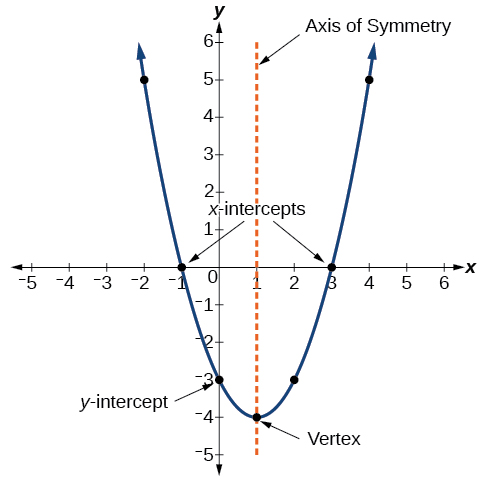
The y -intercept is the point at which the parabola crosses the y -axis. The x -intercepts are the points at which the parabola crosses the x -axis. If they exist, the x -intercepts represent the zeros     , or roots    , of the quadratic function, the values of x at which y = 0.

Identifying the characteristics of a parabola

Determine the vertex, axis of symmetry, zeros, and y - intercept of the parabola shown in [link] .

Graph of a parabola with a vertex at (3, 1) and a y-intercept at (0, 7).

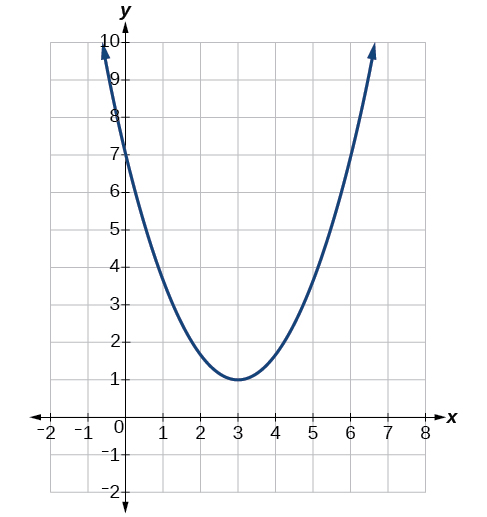
The vertex is the turning point of the graph. We can see that the vertex is at ( 3 , 1 ) . Because this parabola opens upward, the axis of symmetry is the vertical line that intersects the parabola at the vertex. So the axis of symmetry is x = 3. This parabola does not cross the x - axis, so it has no zeros. It crosses the y - axis at ( 0 , 7 ) so this is the y -intercept.

Got questions? Get instant answers now!

Understanding how the graphs of parabolas are related to their quadratic functions

The general form of a quadratic function presents the function in the form

f ( x ) = a x 2 + b x + c

where a , b , and c are real numbers and a 0. If a > 0 , the parabola opens upward. If a < 0 , the parabola opens downward. We can use the general form of a parabola to find the equation for the axis of symmetry.

The axis of symmetry is defined by x = b 2 a . If we use the quadratic formula, x = b ± b 2 4 a c 2 a , to solve a x 2 + b x + c = 0 for the x - intercepts, or zeros, we find the value of x halfway between them is always x = b 2 a , the equation for the axis of symmetry.

[link] represents the graph of the quadratic function written in general form as y = x 2 + 4 x + 3. In this form, a = 1 , b = 4 , and c = 3. Because a > 0 , the parabola opens upward. The axis of symmetry is x = 4 2 ( 1 ) = −2. This also makes sense because we can see from the graph that the vertical line x = −2 divides the graph in half. The vertex always occurs along the axis of symmetry. For a parabola that opens upward, the vertex occurs at the lowest point on the graph, in this instance, ( −2 , −1 ) . The x - intercepts, those points where the parabola crosses the x - axis, occur at ( −3 , 0 ) and ( −1 , 0 ) .

Questions & Answers

Ayele, K., 2003. Introductory Economics, 3rd ed., Addis Ababa.
Widad Reply
can you send the book attached ?
Ariel
?
Ariel
What is economics
Widad Reply
the study of how humans make choices under conditions of scarcity
AI-Robot
U(x,y) = (x×y)1/2 find mu of x for y
Desalegn Reply
U(x,y) = (x×y)1/2 find mu of x for y
Desalegn
what is ecnomics
Jan Reply
this is the study of how the society manages it's scarce resources
Belonwu
what is macroeconomic
John Reply
macroeconomic is the branch of economics which studies actions, scale, activities and behaviour of the aggregate economy as a whole.
husaini
etc
husaini
difference between firm and industry
husaini Reply
what's the difference between a firm and an industry
Abdul
firm is the unit which transform inputs to output where as industry contain combination of firms with similar production 😅😅
Abdulraufu
Suppose the demand function that a firm faces shifted from Qd  120 3P to Qd  90  3P and the supply function has shifted from QS  20  2P to QS 10  2P . a) Find the effect of this change on price and quantity. b) Which of the changes in demand and supply is higher?
Toofiq Reply
explain standard reason why economic is a science
innocent Reply
factors influencing supply
Petrus Reply
what is economic.
Milan Reply
scares means__________________ends resources. unlimited
Jan
economics is a science that studies human behaviour as a relationship b/w ends and scares means which have alternative uses
Jan
calculate the profit maximizing for demand and supply
Zarshad Reply
Why qualify 28 supplies
Milan
what are explicit costs
Nomsa Reply
out-of-pocket costs for a firm, for example, payments for wages and salaries, rent, or materials
AI-Robot
concepts of supply in microeconomics
David Reply
economic overview notes
Amahle Reply
identify a demand and a supply curve
Salome Reply
i don't know
Parul
there's a difference
Aryan
Demand curve shows that how supply and others conditions affect on demand of a particular thing and what percent demand increase whith increase of supply of goods
Israr
Hi Sir please how do u calculate Cross elastic demand and income elastic demand?
Abari
Got questions? Join the online conversation and get instant answers!
Jobilize.com Reply
Practice Key Terms 7

Get Jobilize Job Search Mobile App in your pocket Now!

Get it on Google Play Download on the App Store Now


Source:  OpenStax, Algebra and trigonometry. OpenStax CNX. Nov 14, 2016 Download for free at https://legacy.cnx.org/content/col11758/1.6
Google Play and the Google Play logo are trademarks of Google Inc.

Notification Switch

Would you like to follow the 'Algebra and trigonometry' conversation and receive update notifications?

Ask