Graph plane curves described by parametric equations by plotting points.
Graph parametric equations.
It is the bottom of the ninth inning, with two outs and two men on base. The home team is losing by two runs. The batter swings and hits the baseball at 140 feet per second and at an angle of approximately
to the horizontal. How far will the ball travel? Will it clear the fence for a game-winning home run? The outcome may depend partly on other factors (for example, the wind), but mathematicians can model the path of a projectile and predict approximately how far it will travel using
parametric equations . In this section, we’ll discuss parametric equations and some common applications, such as projectile motion problems.
Parametric equations can model the path of a projectile. (credit: Paul Kreher, Flickr)
Graphing parametric equations by plotting points
In lieu of a graphing calculator or a computer graphing program, plotting points to represent the graph of an equation is the standard method. As long as we are careful in calculating the values, point-plotting is highly dependable.
Given a pair of parametric equations, sketch a graph by plotting points.
Construct a table with three columns:
Evaluate
and
for values of
over the interval for which the functions are defined.
Plot the resulting pairs
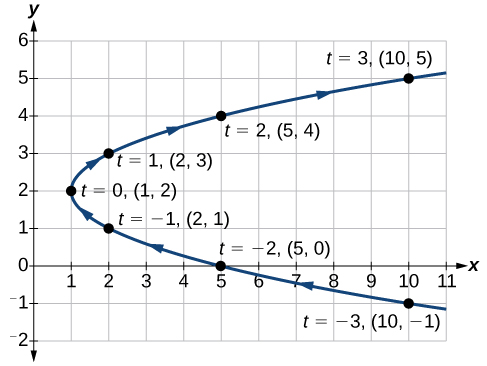
Sketching the graph of a pair of parametric equations by plotting points
Sketch the graph of the
parametric equations
Construct a table of values for
and
as in
[link] , and plot the points in a plane.
The graph is a
parabola with vertex at the point
opening to the right. See
[link] .
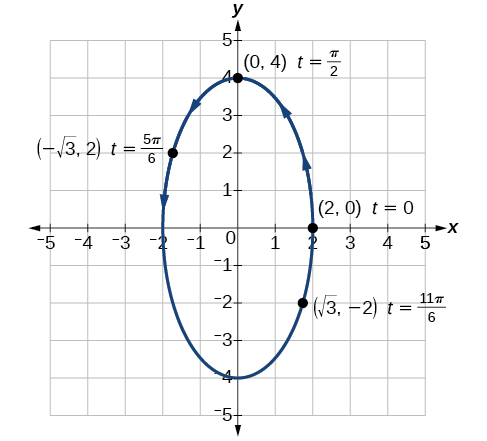
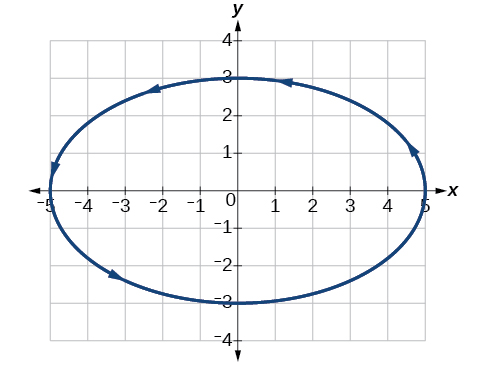
Sketching the graph of trigonometric parametric equations
Construct a table of values for the given parametric equations and sketch the graph:
Construct a table like that in
[link] using angle measure in radians as inputs for
and evaluating
and
Using angles with known sine and cosine values for
makes calculations easier.
By the symmetry shown in the values of
and
we see that the parametric equations represent an
ellipse . The
ellipse is mapped in a counterclockwise direction as shown by the arrows indicating increasing
values.
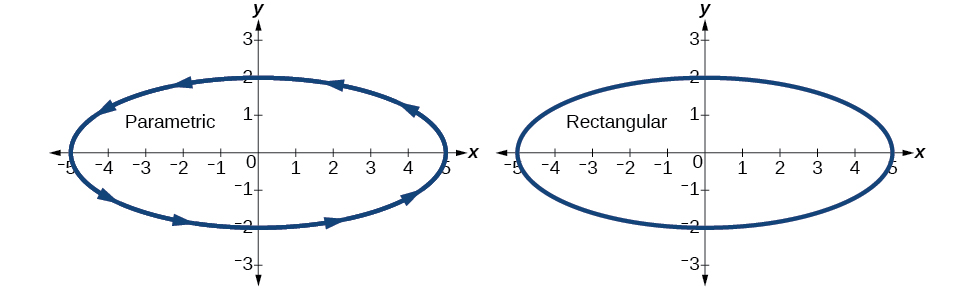
Graphing parametric equations and rectangular form together
Graph the parametric equations
and
First, construct the graph using data points generated from the
parametric form . Then graph the
rectangular form of the equation. Compare the two graphs.
Next, translate the parametric equations to rectangular form. To do this, we solve for
in either
or
and then substitute the expression for
in the other equation. The result will be a function
if solving for
as a function of
or
if solving for
as a function of
is it possible to leave every good at the same level
Joseph
I don't think so. because check it, if the demand for chicken increases, people will no longer consume fish like they used to causing a fall in the demand for fish
Anuolu
is not really possible to let the value of a goods to be same at the same time.....
Salome
Suppose the inflation rate is 6%, does it mean that all the goods you purchase will cost
6% more than previous year? Provide with reasoning.
Not necessarily. To measure the inflation rate economists normally use an averaged price index of a basket of certain goods. So if you purchase goods included in the basket, you will notice that you pay 6% more, otherwise not necessarily.
Good day
How do I calculate this question: C= 100+5yd G= 2000 T= 2000 I(planned)=200.
Suppose the actual output is 3000. What is the level of planned expenditures at this level of output?
I am Camara from Guinea west Africa... happy to meet you guys here
Sekou
ma management ho
Amisha
ahile becheclor ho
Amisha
hjr ktm bta ho
ani k kaam grnu hunxa tw
Amisha
belatari
Amisha
1st year ho
Amisha
nd u
Amisha
ahh
Amisha
kaha biratnagar
Amisha
ys
Amisha
kina k vo
Amisha
money as unit of account means what?
Kalombe
A unit of account is something that can be used to value goods and services and make calculations
Jim
all of you please speak in English I can't understand you're language
Muhammad
I want to know how can we define macroeconomics in one line
Muhammad
it must be .9 or 0.9
no Mpc is greater than 1
Y=100+.9Y+50
Y-.9Y=150
0.1Y/0.1=150/0.1
Y=1500
Kalombe
Mercy is it clear?😋
Kalombe
hi can someone help me on this question
If a negative shocks shifts the IS curve to the left, what type of policy do you suggest so as to stabilize the level of output?
discuss your answer using appropriate graph.