<< Chapter < Page Chapter >> Page >

Because r is significant and the scatter plot shows a linear trend, the regression line can be used to predict final exam scores.

Method 2: using a table of critical values to make a decision

The 95% Critical Values of the Sample Correlation Coefficient Table can be used to give you a good idea of whether the computed value of r is significant or not . Compare r to the appropriate critical value in the table. If r is not between the positive and negative critical values, then the correlation coefficient is significant. If r is significant, then you may want to use the line for prediction.

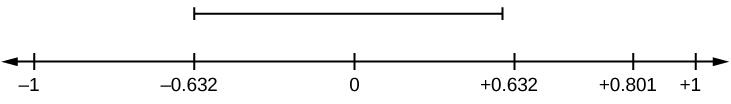
Suppose you computed r = 0.801 using n = 10 data points. df = n - 2 = 10 - 2 = 8. The critical values associated with df = 8 are -0.632 and + 0.632. If r <negative critical value or r >positive critical value, then r issignificant. Since r = 0.801 and 0.801>0.632, r is significant and the line may be usedfor prediction. If you view this example on a number line, it will help you.

Horizontal number line with values of -1, -0.632, 0, 0.632, 0.801, and 1. A dashed line above values -0.632, 0, and 0.632 indicates not significant values.
r is not significant between -0.632 and +0.632. r = 0.801>+0.632. Therefore, r is significant.
Got questions? Get instant answers now!

Try it

For a given line of best fit, you computed that r = 0.6501 using n = 12 data points and the critical value is 0.576. Can the line be used for prediction? Why or why not?

If the scatter plot looks linear then, yes, the line can be used for prediction, because r >the positive critical value.

Got questions? Get instant answers now!

Suppose you computed r = –0.624 with 14 data points. df = 14 – 2 = 12. The critical values are –0.532 and 0.532. Since –0.624<–0.532, r is significant and the line can be used for prediction

Horizontal number line with values of -0.624, -0.532, and 0.532.
r = –0.624-0.532. Therefore, r is significant.
Got questions? Get instant answers now!

Try it

For a given line of best fit, you compute that r = 0.5204 using n = 9 data points, and the critical value is 0.666. Can the line be used for prediction? Why or why not?

No, the line cannot be used for prediction, because r <the positive critical value.

Got questions? Get instant answers now!

Suppose you computed r = 0.776 and n = 6. df = 6 – 2 = 4. The critical values are –0.811 and 0.811. Since –0.811<0.776<0.811, r is not significant, and the line should not be used for prediction.

Horizontal number line with values -0.924, -0.532, and 0.532.
-0.811< r = 0.776<0.811. Therefore, r is not significant.
Got questions? Get instant answers now!

Try it

For a given line of best fit, you compute that r = –0.7204 using n = 8 data points, and the critical value is = 0.707. Can the line be used for prediction? Why or why not?

Yes, the line can be used for prediction, because r<the negative critical value.

Got questions? Get instant answers now!

Third-exam vs final-exam example: critical value method

Consider the third exam/final exam example . The line of best fit is: ŷ = –173.51+4.83 x with r = 0.6631 and there are n = 11 data points. Can the regression line be used for prediction? Given a third-exam score ( x value), can we use the line to predict the final exam score (predicted y value)?

  • H 0 : ρ = 0
  • H a : ρ ≠ 0
  • α = 0.05
  • Use the "95% Critical Value" table for r with df = n – 2 = 11 – 2 = 9.
  • The critical values are –0.602 and +0.602
  • Since 0.6631>0.602, r is significant.
  • Decision: Reject the null hypothesis.
  • Conclusion:There is sufficient evidence to conclude that there is a significant linear relationship between the third exam score ( x ) and the final exam score ( y ) because the correlation coefficient is significantly different from zero.

Questions & Answers

calculate molarity of NaOH solution when 25.0ml of NaOH titrated with 27.2ml of 0.2m H2SO4
Gasin Reply
what's Thermochemistry
rhoda Reply
the study of the heat energy which is associated with chemical reactions
Kaddija
How was CH4 and o2 was able to produce (Co2)and (H2o
Edafe Reply
explain please
Victory
First twenty elements with their valences
Martine Reply
what is chemistry
asue Reply
what is atom
asue
what is the best way to define periodic table for jamb
Damilola Reply
what is the change of matter from one state to another
Elijah Reply
what is isolation of organic compounds
IKyernum Reply
what is atomic radius
ThankGod Reply
Read Chapter 6, section 5
Dr
Read Chapter 6, section 5
Kareem
Atomic radius is the radius of the atom and is also called the orbital radius
Kareem
atomic radius is the distance between the nucleus of an atom and its valence shell
Amos
Read Chapter 6, section 5
paulino
Bohr's model of the theory atom
Ayom Reply
is there a question?
Dr
when a gas is compressed why it becomes hot?
ATOMIC
It has no oxygen then
Goldyei
read the chapter on thermochemistry...the sections on "PV" work and the First Law of Thermodynamics should help..
Dr
Which element react with water
Mukthar Reply
Mgo
Ibeh
an increase in the pressure of a gas results in the decrease of its
Valentina Reply
definition of the periodic table
Cosmos Reply
What is the lkenes
Da Reply
what were atoms composed of?
Moses Reply
Got questions? Join the online conversation and get instant answers!
Jobilize.com Reply

Get Jobilize Job Search Mobile App in your pocket Now!

Get it on Google Play Download on the App Store Now


Source:  OpenStax, Introductory statistics. OpenStax CNX. May 06, 2016 Download for free at http://legacy.cnx.org/content/col11562/1.18
Google Play and the Google Play logo are trademarks of Google Inc.

Notification Switch

Would you like to follow the 'Introductory statistics' conversation and receive update notifications?

Ask