Home
Introductory statistics Introductory statistics
Notes for the ti-83, 83+, 84,
To deselect equations:
Access the list of equations.
Select each equal sign (=).
Continue, until all equations are deselected.
To clear equations:
Access the list of equations.
Use the arrow keys to navigate to the right of each equal sign (=) and clear them.
Repeat until all equations are deleted.
To draw default histogram:
Access the ZOOM menu.
Select
<9:ZoomStat> .
The histogram will show with a window automatically set.
To draw custom histogram:
Access window mode to set the graph parameters.
X
min
=
–2.5
X
max
=
3.5
X
s
c
l
=
1 (width of bars)
Y
min
=
0
Y
max
=
10
Y
s
c
l
=
1 (spacing of tick marks on
y -axis)
X
r
e
s
=
1
Access graphing mode to see the histogram.
To draw box plots:
Access graphing mode.
,
[STAT PLOT]
Select
<1:Plot 1> to access the first graph.
Use the arrows to select
<ON> and turn on Plot 1.
Use the arrows to select the box plot picture and enable it.
Use the arrows to navigate to
<Xlist> .
If "L1" is not selected, select it.
,
[L1] ,
Use the arrows to navigate to
<Freq> .
Indicate that the frequencies are in
[L2] .
,
[L2] ,
Go back to access other graphs.
,
[STAT PLOT]
Be sure to deselect or clear all equations before graphing using the method mentioned above.
View the box plot.
,
[STAT PLOT]
Linear regression
Sample data
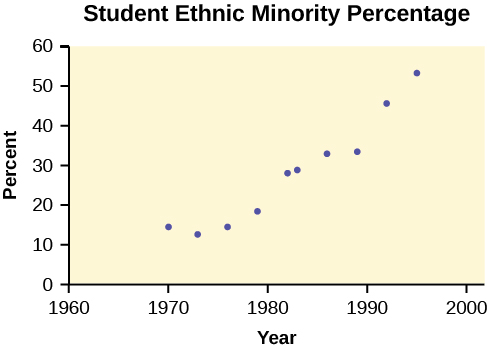
The following data is real. The percent of declared ethnic minority students at De Anza College for selected years from 1970–1995 was:
Year
Student Ethnic Minority Percentage
1970
14.13
1973
12.27
1976
14.08
1979
18.16
1982
27.64
1983
28.72
1986
31.86
1989
33.14
1992
45.37
1995
53.1
The independent variable is "Year," while the independent variable is "Student Ethnic Minority Percent."
Student ethnic minority percentage
By hand, verify the scatterplot above.
Note
The TI-83 has a built-in linear regression feature, which allows the data to be edited.The
x -values will be in
[L1] ; the
y -values in
[L2] .
To enter data and do linear regression:
ON Turns calculator on.
Before accessing this program, be sure to turn off all plots.
Round to three decimal places. To do so:
Access the mode menu.
,
[STAT PLOT]
Navigate to
<Float> and then to the right to
<3> .
All numbers will be rounded to three decimal places until changed.
Enter statistics mode and clear lists
[L1] and
[L2] , as describe previously.
,
Enter editing mode to insert values for
x and
y .
,
Enter each value. Press
to continue.
To display the correlation coefficient:
Access the catalog.
,
[CATALOG]
Arrow down and select
<DiagnosticOn>
... ,
,
r and
r
2 will be displayed during regression calculations.
Access linear regression.
Select the form of
y =
a +
bx .
,
Linreg
y =
a +
bx
a = –3176.909
b = 1.617
r = 2 0.924
r = 0.961
y = –3176.909 + 1.617
x
Percent = –3176.909 + 1.617 (year #) The correlation coefficient
r = 0.961
To see the scatter plot:
Access graphing mode.
,
[STAT PLOT]
Select
<1:plot 1> To access plotting - first graph.
Navigate and select
<ON> to turn on Plot 1.
<ON>
Navigate to the first picture.
Select the scatter plot.
Navigate to
<Xlist> .
If
[L1] is not selected, press
,
[L1] to select it.
Confirm that the data values are in
[L1] .
<ON>
Navigate to
<Ylist> .
Select that the frequencies are in
[L2] .
,
[L2] ,
Go back to access other graphs.
,
[STAT PLOT]
Use the arrows to turn off the remaining plots.
Access window mode to set the graph parameters.
X
min
=
1970
X
max
=
2000
X
s
c
l
=
10 (spacing of tick marks on
x -axis)
Y
min
=
−
0.05
Y
max
=
60
Y
s
c
l
=
10 (spacing of tick marks on
y -axis)
X
r
e
s
=
1
Be sure to deselect or clear all equations before graphing, using the instructions above.
Press the graph button to see the scatter plot.
Questions & Answers
summarize halerambos & holbon
the Three stages of Auguste Comte
what are agents of socialization
definition of sociology of education
Nuhu
shared beliefs, values, and practices
AI-Robot
What are the two type of scientific method
what are the scientific method of sociology
Man
the process wherein people come to understand societal norms and expectations, to accept society's beliefs, and to be aware of societal values
AI-Robot
scientific method in doing research
ogunniran
defimition of sickness in afica
Anita
list and explain the terms that found in society
list and explain the terms that found in society
Mukhtar
what are the agents of socialization
Antonio
Family
Peer group
Institution
Abdulwajud
I mean the definition
Antonio
ways of perceived deviance indifferent society
reasons of joining groups
SAM
to bring development to the nation at large
Hyellafiya
entails of consultative and consensus building from others
Gadama
World first Sociologist?
Abu
What is evolutionary model
Evolution models refer to mathematical and computational representations of the processes involved in biological evolution. These models aim to simulate and understand how species change over time through mechanisms such as natural selection, genetic drift, and mutation. Evolutionary models can be u
faruk
what are the modern trends in religious behaviours
shared standards of acceptable behavior by the group or appropriate behavior in a particular institution or those behaviors that are acceptable in a society
Lucius
that is how i understood it
Lucius
examples of societal norms
Diamond
Discuss the characteristics of the research located within positivist and the interpretivist paradigm
what is Industrialisation
Got questions? Join the online conversation and get instant answers!
Source:
OpenStax, Introductory statistics. OpenStax CNX. May 06, 2016 Download for free at http://legacy.cnx.org/content/col11562/1.18
Google Play and the Google Play logo are trademarks of Google Inc.