<< Chapter < Page
  Introductory statistics     Page 36 / 36
Chapter >> Page >

26 . In a survey of 80 males, 45 had played an organized sport growing up. Of the 70 females surveyed, 25 had played an organized sport growing up. We are interested in whether the proportion for males is higher than the proportion for females. The correct conclusion is that:

  1. there is insufficient information to conclude that the proportion for males is the same as the proportion for females.
  2. there is insufficient information to conclude that the proportion for males is not the same as the proportion for females.
  3. there is sufficient evidence to conclude that the proportion for males is higher than the proportion for females.
  4. not enough information to make a conclusion.

27 . From past experience, a statistics teacher has found that the average score on a midterm is 81 with a standard deviation of 5.2. This term, a class of 49 students had a standard deviation of 5 on the midterm. Do the data indicate that we should reject the teacher’s claim that the standard deviation is 5.2? Use α = 0.05.

  1. Yes
  2. No
  3. Not enough information given to solve the problem

28 . Three loading machines are being compared. Ten samples were taken for each machine. Machine I took an average of 31 minutes to load packages with a standard deviation of two minutes. Machine II took an average of 28 minutes to load packages with a standard deviation of 1.5 minutes. Machine III took an average of 29 minutes to load packages with a standard deviation of one minute. Find the p -value when testing that the average loading times are the same.

  1. p -value is close to zero
  2. p -value is close to one
  3. not enough information given to solve the problem


Use the following information to answer the next three exercises: A corporation has offices in different parts of the country. It has gathered the following information concerning the number of bathrooms and the number of employees at seven sites:

Number of employees x 650 730 810 900 102 107 1150
Number of bathrooms y 40 50 54 61 82 110 121

29 . Is the correlation between the number of employees and the number of bathrooms significant?

  1. Yes
  2. No
  3. Not enough information to answer question

30 . The linear regression equation is:

  1. ŷ = 0.0094 − 79.96 x
  2. ŷ = 79.96 + 0.0094 x
  3. ŷ = 79.96 − 0.0094 x
  4. ŷ = − 0.0094 + 79.96 x

31 . If a site has 1,150 employees, approximately how many bathrooms should it have?

  1. 69
  2. 91
  3. 91,954
  4. We should not be estimating here.

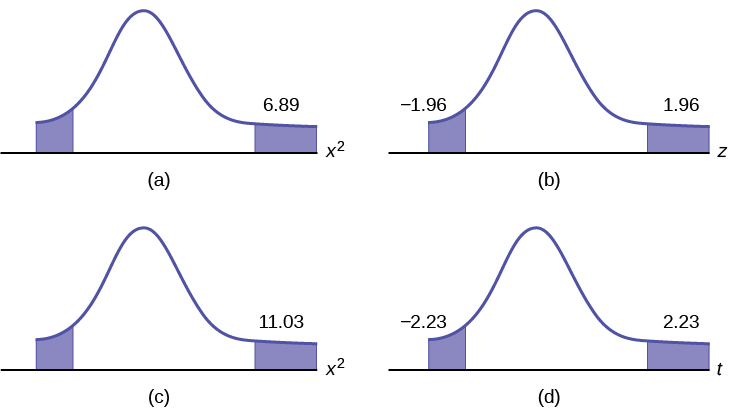
32 . Suppose that a sample of size ten was collected, with x ¯ = 4.4 and s = 1.4. H 0 : σ 2 = 1.6 vs. H a : σ 2 ≠ 1.6. Which graph best describes the results of the test?

There are 4 curves that display the P-value for a Test of a Single Variance. Graph (a) shows two tails shaded for chi-square = 6.89. Graph (b) shows two tails shaded for chi-square = 1.96. Graph (c) shows two tails shaded for chi-square = 11.03. Graph (d) shows two tails shaded for chi-square = 2.23.

Sixty-four backpackers were asked the number of days since their latest backpacking trip. The number of days is given in [link] :

# of days 1 2 3 4 5 6 7 8
Frequency 5 9 6 12 7 10 5 10

33 . Conduct an appropriate test to determine if the distribution is uniform.

  1. The p -value is>0.10. There is insufficient information to conclude that the distribution is not uniform.
  2. The p -value is<0.01. There is sufficient information to conclude the distribution is not uniform.
  3. The p -value is between 0.01 and 0.10, but without alpha ( α ) there is not enough information
  4. There is no such test that can be conducted.

34 . Which of the following statements is true when using one-way ANOVA?

  1. The populations from which the samples are selected have different distributions.
  2. The sample sizes are large.
  3. The test is to determine if the different groups have the same means.
  4. There is a correlation between the factors of the experiment.

Practice final exam 2 solutions

Solutions

1 . b. parameter.

2 . a.

3 . c. seven

4 . c. 0.02

5 . c. none of the above

6 . d. 100 140

7 . a. ≈ 0

8 . b. The values for x are: {1, 2, 3,..., 14}

9 . c. 0.9417.

10 . d. binomial

11 . d. 8.7

12 . a. –1.96

13 . a. 0.6321

14 . d. 360

15 . b. N ( 72 , 72 50 )

16 . a. 3 9

17 . d.

18 . b. 5.5

19 . d. 6.92

20 . a. 5

21 . b. 0.8541

22 . b. 0.2

23 . a. –1.

24 . c. matched pairs, dependent groups.

25 . d. Reject H 0 . There is sufficient evidence to conclude that there is a difference in the mean scores.

26 . c. there is sufficient evidence to conclude that the proportion for males is higher than the proportion for females.

27 . b. no

28 . b. p -value is close to 1.

29 . b. No

30 . c. y ^ = 79.96 x – 0.0094

31 . d. We should not be estimating here.

32 . a.

33 . a. The p -value is>0.10. There is insufficient information to conclude that the distribution is not uniform.

34 . c. The test is to determine if the different groups have the same means.

Questions & Answers

Ayele, K., 2003. Introductory Economics, 3rd ed., Addis Ababa.
Widad Reply
can you send the book attached ?
Ariel
?
Ariel
What is economics
Widad Reply
the study of how humans make choices under conditions of scarcity
AI-Robot
U(x,y) = (x×y)1/2 find mu of x for y
Desalegn Reply
U(x,y) = (x×y)1/2 find mu of x for y
Desalegn
what is ecnomics
Jan Reply
this is the study of how the society manages it's scarce resources
Belonwu
what is macroeconomic
John Reply
macroeconomic is the branch of economics which studies actions, scale, activities and behaviour of the aggregate economy as a whole.
husaini
etc
husaini
difference between firm and industry
husaini Reply
what's the difference between a firm and an industry
Abdul
firm is the unit which transform inputs to output where as industry contain combination of firms with similar production 😅😅
Abdulraufu
Suppose the demand function that a firm faces shifted from Qd  120 3P to Qd  90  3P and the supply function has shifted from QS  20  2P to QS 10  2P . a) Find the effect of this change on price and quantity. b) Which of the changes in demand and supply is higher?
Toofiq Reply
explain standard reason why economic is a science
innocent Reply
factors influencing supply
Petrus Reply
what is economic.
Milan Reply
scares means__________________ends resources. unlimited
Jan
economics is a science that studies human behaviour as a relationship b/w ends and scares means which have alternative uses
Jan
calculate the profit maximizing for demand and supply
Zarshad Reply
Why qualify 28 supplies
Milan
what are explicit costs
Nomsa Reply
out-of-pocket costs for a firm, for example, payments for wages and salaries, rent, or materials
AI-Robot
concepts of supply in microeconomics
David Reply
economic overview notes
Amahle Reply
identify a demand and a supply curve
Salome Reply
i don't know
Parul
there's a difference
Aryan
Demand curve shows that how supply and others conditions affect on demand of a particular thing and what percent demand increase whith increase of supply of goods
Israr
Hi Sir please how do u calculate Cross elastic demand and income elastic demand?
Abari
Got questions? Join the online conversation and get instant answers!
Jobilize.com Reply

Get Jobilize Job Search Mobile App in your pocket Now!

Get it on Google Play Download on the App Store Now


Source:  OpenStax, Introductory statistics. OpenStax CNX. May 06, 2016 Download for free at http://legacy.cnx.org/content/col11562/1.18
Google Play and the Google Play logo are trademarks of Google Inc.

Notification Switch

Would you like to follow the 'Introductory statistics' conversation and receive update notifications?

Ask