

| << Chapter < Page | Chapter >> Page > |
It is important for you to understand when to use the central limit theorem . If you are being asked to find the probability of the mean, use the clt for the mean. If you are being asked to find the probability of a sum or total, use the clt for sums. This also applies to percentiles for means and sums.
If you are being asked to find the probability of an individual value, do not use the clt. Use the distribution of its random variable.
The law of large numbers says that if you take samples of larger and larger size from any population, then the mean of the sample tends to get closer and closer to μ . From the central limit theorem, we know that as n gets larger and larger, the sample means follow a normal distribution. The larger n gets, the smaller the standard deviation gets. (Remember that the standard deviation for is .) This means that the sample mean must be close to the population mean μ . We can say that μ is the value that the sample means approach as n gets larger. The central limit theorem illustrates the law of large numbers.
A study involving stress is conducted among the students on a college campus. The stress scores follow a uniform distribution with the lowest stress score equal to one and the highest equal to five. Using a sample of 75 students, find:
Let X = one stress score.
Problems a and b ask you to find a probability or a percentile for a mean . Problems c and d ask you to find a probability or a percentile for a total or sum . The sample size, n , is equal to 75.
Since the individual stress scores follow a uniform distribution, X ~ U (1, 5) where a = 1 and b = 5 (See Continuous Random Variables for an explanation on the uniform distribution).
μ X = = = 3
σ X = = = 1.15
For problems 1. and 2., let = the mean stress score for the 75 students. Then,
∼ N where n = 75.
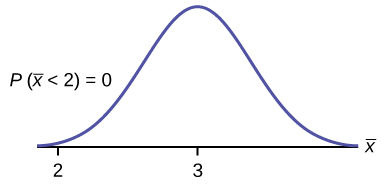
a. Find P ( <2). Draw the graph.
a. P ( <2) = 0
The probability that the mean stress score is less than two is about zero.
normalcdf
= 0
The smallest stress score is one.
b. Find the 90 th percentile for the mean of 75 stress scores. Draw a graph.
b. Let k = the 90 th precentile.
Find k , where P ( < k ) = 0.90.
k = 3.2
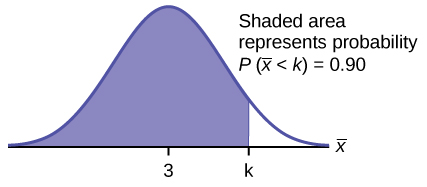
The 90 th percentile for the mean of 75 scores is about 3.2. This tells us that 90% of all the means of 75 stress scores are at most 3.2, and that 10% are at least 3.2.
invNorm
= 3.2
For problems c and d, let ΣX = the sum of the 75 stress scores. Then, ΣX ~ N [(75)(3), (1.15)]
c. Find P ( Σx <200). Draw the graph.
c. The mean of the sum of 75 stress scores is (75)(3) = 225
The standard deviation of the sum of 75 stress scores is (1.15) = 9.96
P ( Σx <200) = 0
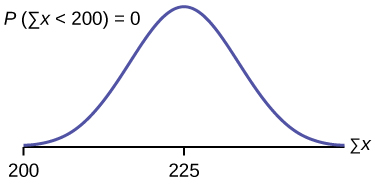
The probability that the total of 75 scores is less than 200 is about zero.
normalcdf (75,200,(75)(3),
(1.15)).
The smallest total of 75 stress scores is 75, because the smallest single score is one.
Notification Switch
Would you like to follow the 'Introductory statistics' conversation and receive update notifications?

|
|
|
|
|

|
|

|
|

|
|

|
|

|
|

|
|

|
|

|
|

|
|
|
|