<< Chapter < Page Chapter >> Page >

Try it

It’s a Boy Genetics Labs claim their procedures improve the chances of a boy being born. The results for a test of a single population proportion are as follows:

H 0 : p = 0.50, H a : p >0.50

α = 0.01

p -value = 0.025

Interpret the results and state a conclusion in simple, non-technical terms.

Since the p -value is greater than the established alpha value (the p -value is high), we do not reject the null hypothesis. There is not enough evidence to support It’s a Boy Genetics Labs' stated claim that their procedures improve the chances of a boy being born.

Got questions? Get instant answers now!

Chapter review

When the probability of an event occurring is low, and it happens, it is called a rare event. Rare events are important to consider in hypothesis testing because they can inform your willingness not to reject or to reject a null hypothesis. To test a null hypothesis, find the p -value for the sample data and graph the results. When deciding whether or not to reject the null the hypothesis, keep these two parameters in mind:

  1. α > p -value, reject the null hypothesis
  2. α p -value, do not reject the null hypothesis

When do you reject the null hypothesis?

Got questions? Get instant answers now!

The probability of winning the grand prize at a particular carnival game is 0.005. Is the outcome of winning very likely or very unlikely?

The outcome of winning is very unlikely.

Got questions? Get instant answers now!

The probability of winning the grand prize at a particular carnival game is 0.005. Michele wins the grand prize. Is this considered a rare or common event? Why?

Got questions? Get instant answers now!

It is believed that the mean height of high school students who play basketball on the school team is 73 inches with a standard deviation of 1.8 inches. A random sample of 40 players is chosen. The sample mean was 71 inches, and the sample standard deviation was 1.5 years. Do the data support the claim that the mean height is less than 73 inches? The p -value is almost zero. State the null and alternative hypotheses and interpret the p -value.

H 0 : μ >= 73
H a : μ <73
The p -value is almost zero, which means there is sufficient data to conclude that the mean height of high school students who play basketball on the school team is less than 73 inches at the 5% level. The data do support the claim.

Got questions? Get instant answers now!

The mean age of graduate students at a University is at most 31 y ears with a standard deviation of two years. A random sample of 15 graduate students is taken. The sample mean is 32 years and the sample standard deviation is three years. Are the data significant at the 1% level? The p -value is 0.0264. State the null and alternative hypotheses and interpret the p -value.

Got questions? Get instant answers now!

Does the shaded region represent a low or a high p -value compared to a level of significance of 1%?

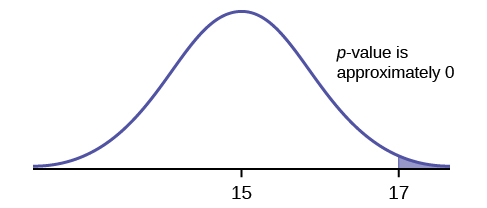
The shaded region shows a low p -value.

Got questions? Get instant answers now!

What should you do when α > p -value?

Got questions? Get instant answers now!

What should you do if α = p -value?

Do not reject H 0 .

Got questions? Get instant answers now!

If you do not reject the null hypothesis, then it must be true. Is this statement correct? State why or why not in complete sentences.

Got questions? Get instant answers now!

Use the following information to answer the next seven exercises: Suppose that a recent article stated that the mean time spent in jail by a first-time convicted burglar is 2.5 years. A study was then done to see if the mean time has increased in the new century. A random sample of 26 first-time convicted burglars in a recent year was picked. The mean length of time in jail from the survey was three years with a standard deviation of 1.8 years. Suppose that it is somehow known that the population standard deviation is 1.5. Conduct a hypothesis test to determine if the mean length of jail time has increased. Assume the distribution of the jail times is approximately normal.

Is this a test of means or proportions?

means

Got questions? Get instant answers now!

What symbol represents the random variable for this test?

Got questions? Get instant answers now!

In words, define the random variable for this test.

the mean time spent in jail for 26 first time convicted burglars

Got questions? Get instant answers now!

Is the population standard deviation known and, if so, what is it?

Got questions? Get instant answers now!

Calculate the following:

  1. x ¯ _______
  2. σ _______
  3. s x _______
  4. n _______

  1. 3
  2. 1.5
  3. 1.8
  4. 26
Got questions? Get instant answers now!

Since both σ and s x are given, which should be used? In one to two complete sentences, explain why.

Got questions? Get instant answers now!

State the distribution to use for the hypothesis test.

X ¯ ~ N ( 2.5 , 1.5 26 )

Got questions? Get instant answers now!

A random survey of 75 death row inmates revealed that the mean length of time on death row is 17.4 years with a standard deviation of 6.3 years. Conduct a hypothesis test to determine if the population mean time on death row could likely be 15 years.

  1. Is this a test of one mean or proportion?
  2. State the null and alternative hypotheses.
    H 0 : ____________________ H a : ____________________
  3. Is this a right-tailed, left-tailed, or two-tailed test?
  4. What symbol represents the random variable for this test?
  5. In words, define the random variable for this test.
  6. Is the population standard deviation known and, if so, what is it?
  7. Calculate the following:
    1. x ¯ = _____________
    2. s = ____________
    3. n = ____________
  8. Which test should be used?
  9. State the distribution to use for the hypothesis test.
  10. Find the p -value.
  11. At a pre-conceived α = 0.05, what is your:
    1. Decision:
    2. Reason for the decision:
    3. Conclusion (write out in a complete sentence):
Got questions? Get instant answers now!

Questions & Answers

how do you get the 2/50
Abba Reply
number of sport play by 50 student construct discrete data
Aminu Reply
width of the frangebany leaves on how to write a introduction
Theresa Reply
Solve the mean of variance
Veronica Reply
Step 1: Find the mean. To find the mean, add up all the scores, then divide them by the number of scores. ... Step 2: Find each score's deviation from the mean. ... Step 3: Square each deviation from the mean. ... Step 4: Find the sum of squares. ... Step 5: Divide the sum of squares by n – 1 or N.
kenneth
what is error
Yakuba Reply
Is mistake done to something
Vutshila
Hy
anas
hy
What is the life teble
anas
hy
Jibrin
statistics is the analyzing of data
Tajudeen Reply
what is statics?
Zelalem Reply
how do you calculate mean
Gloria Reply
diveving the sum if all values
Shaynaynay
let A1,A2 and A3 events be independent,show that (A1)^c, (A2)^c and (A3)^c are independent?
Fisaye Reply
what is statistics
Akhisani Reply
data collected all over the world
Shaynaynay
construct a less than and more than table
Imad Reply
The sample of 16 students is taken. The average age in the sample was 22 years with astandard deviation of 6 years. Construct a 95% confidence interval for the age of the population.
Aschalew Reply
Bhartdarshan' is an internet-based travel agency wherein customer can see videos of the cities they plant to visit. The number of hits daily is a normally distributed random variable with a mean of 10,000 and a standard deviation of 2,400 a. what is the probability of getting more than 12,000 hits? b. what is the probability of getting fewer than 9,000 hits?
Akshay Reply
Bhartdarshan'is an internet-based travel agency wherein customer can see videos of the cities they plan to visit. The number of hits daily is a normally distributed random variable with a mean of 10,000 and a standard deviation of 2,400. a. What is the probability of getting more than 12,000 hits
Akshay
1
Bright
Sorry i want to learn more about this question
Bright
Someone help
Bright
a= 0.20233 b=0.3384
Sufiyan
a
Shaynaynay
How do I interpret level of significance?
Mohd Reply
It depends on your business problem or in Machine Learning you could use ROC- AUC cruve to decide the threshold value
Shivam
how skewness and kurtosis are used in statistics
Owen Reply
yes what is it
Taneeya

Get Jobilize Job Search Mobile App in your pocket Now!

Get it on Google Play Download on the App Store Now


Source:  OpenStax, Introductory statistics. OpenStax CNX. May 06, 2016 Download for free at http://legacy.cnx.org/content/col11562/1.18
Google Play and the Google Play logo are trademarks of Google Inc.

Notification Switch

Would you like to follow the 'Introductory statistics' conversation and receive update notifications?

Ask