<< Chapter < Page Chapter >> Page >

Try it

A new prep class was designed to improve SAT test scores. Five students were selected at random. Their scores on two practice exams were recorded, one before the class and one after. The data recorded in [link] . Are the scores, on average, higher after the class? Test at a 5% level.

SAT Scores Student 1 Student 2 Student 3 Student 4
Score before class 1840 1960 1920 2150
Score after class 1920 2160 2200 2100

The p -value is 0.0874, so we decline to reject the null hypothesis. The data do not support that the class improves SAT scores significantly.

Got questions? Get instant answers now!

Seven eighth graders at Kennedy Middle School measured how far they could push the shot-put with their dominant (writing) hand and their weaker (non-writing) hand. They thought that they could push equal distances with either hand. The data were collected and recorded in [link] .

Distance (in feet) using Student 1 Student 2 Student 3 Student 4 Student 5 Student 6 Student 7
Dominant Hand 30 26 34 17 19 26 20
Weaker Hand 28 14 27 18 17 26 16

Conduct a hypothesis test to determine whether the mean difference in distances between the children’s dominant versus weaker hands is significant.

Record the differences data. Calculate the differences by subtracting the distances with the weaker hand from the distances with the dominant hand. The data for the differences are: {2, 12, 7, –1, 2, 0, 4}. The differences have a normal distribution.

Using the differences data, calculate the sample mean and the sample standard deviation. x ¯ d = 3.71, s d = 4.5.

Random variable: X ¯ d = mean difference in the distances between the hands.

Distribution for the hypothesis test: t 6

H 0 : μ d = 0  H a : μ d ≠ 0

Graph:
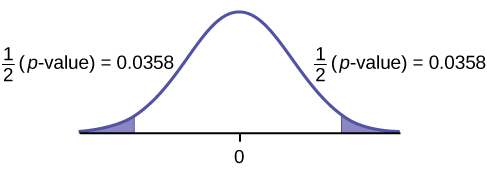
This is a normal distribution curve with mean equal to zero. Both the right and left tails of the curve are shaded. Each tail represents 1/2(p-value) = 0.0358.

Calculate the p -value: The p -value is 0.0716 (using the data directly).

(test statistic = 2.18. p -value = 0.0719 using ( x ¯ d = 3.71 ,   s d = 4.5. )

Decision: Assume α = 0.05. Since α < p -value, Do not reject H 0 .

Conclusion: At the 5% level of significance, from the sample data, there is not sufficient evidence to conclude that there is a difference in the children’s weaker and dominant hands to push the shot-put.

Got questions? Get instant answers now!

Try-it

Five ball players think they can throw the same distance with their dominant hand (throwing) and off-hand (catching hand). The data were collected and recorded in [link] . Conduct a hypothesis test to determine whether the mean difference in distances between the dominant and off-hand is significant. Test at the 5% level.

Player 1 Player 2 Player 3 Player 4 Player 5
Dominant Hand 120 111 135 140 125
Off-hand 105 109 98 111 99

The p -level is 0.0230, so we can reject the null hypothesis. The data show that the players do not throw the same distance with their off-hands as they do with their dominant hands.

Got questions? Get instant answers now!

Chapter review

A hypothesis test for matched or paired samples (t-test) has these characteristics:

  • Test the differences by subtracting one measurement from the other measurement
  • Random Variable: x ¯ d = mean of the differences
  • Distribution: Student’s-t distribution with n – 1 degrees of freedom
  • If the number of differences is small (less than 30), the differences must follow a normal distribution.
  • Two samples are drawn from the same set of objects.
  • Samples are dependent.

Questions & Answers

what is phylogeny
Odigie Reply
evolutionary history and relationship of an organism or group of organisms
AI-Robot
ok
Deng
what is biology
Hajah Reply
the study of living organisms and their interactions with one another and their environments
AI-Robot
what is biology
Victoria Reply
HOW CAN MAN ORGAN FUNCTION
Alfred Reply
the diagram of the digestive system
Assiatu Reply
allimentary cannel
Ogenrwot
How does twins formed
William Reply
They formed in two ways first when one sperm and one egg are splited by mitosis or two sperm and two eggs join together
Oluwatobi
what is genetics
Josephine Reply
Genetics is the study of heredity
Misack
how does twins formed?
Misack
What is manual
Hassan Reply
discuss biological phenomenon and provide pieces of evidence to show that it was responsible for the formation of eukaryotic organelles
Joseph Reply
what is biology
Yousuf Reply
the study of living organisms and their interactions with one another and their environment.
Wine
discuss the biological phenomenon and provide pieces of evidence to show that it was responsible for the formation of eukaryotic organelles in an essay form
Joseph Reply
what is the blood cells
Shaker Reply
list any five characteristics of the blood cells
Shaker
lack electricity and its more savely than electronic microscope because its naturally by using of light
Abdullahi Reply
advantage of electronic microscope is easily and clearly while disadvantage is dangerous because its electronic. advantage of light microscope is savely and naturally by sun while disadvantage is not easily,means its not sharp and not clear
Abdullahi
cell theory state that every organisms composed of one or more cell,cell is the basic unit of life
Abdullahi
is like gone fail us
DENG
cells is the basic structure and functions of all living things
Ramadan
What is classification
ISCONT Reply
is organisms that are similar into groups called tara
Yamosa
in what situation (s) would be the use of a scanning electron microscope be ideal and why?
Kenna Reply
A scanning electron microscope (SEM) is ideal for situations requiring high-resolution imaging of surfaces. It is commonly used in materials science, biology, and geology to examine the topography and composition of samples at a nanoscale level. SEM is particularly useful for studying fine details,
Hilary
Got questions? Join the online conversation and get instant answers!
Jobilize.com Reply

Get Jobilize Job Search Mobile App in your pocket Now!

Get it on Google Play Download on the App Store Now


Source:  OpenStax, Introductory statistics. OpenStax CNX. May 06, 2016 Download for free at http://legacy.cnx.org/content/col11562/1.18
Google Play and the Google Play logo are trademarks of Google Inc.

Notification Switch

Would you like to follow the 'Introductory statistics' conversation and receive update notifications?

Ask