<< Chapter < Page Chapter >> Page >

Try it

[link] shows a different random sampling of 20 cell phone models. Use this data to calculate a 93% confidence interval for the true mean SAR for cell phones certified for use in the United States. As previously, assume that the population standard deviation is σ = 0.337.

Phone Model SAR Phone Model SAR
Blackberry Pearl 8120 1.48 Nokia E71x 1.53
HTC Evo Design 4G 0.8 Nokia N75 0.68
HTC Freestyle 1.15 Nokia N79 1.4
LG Ally 1.36 Sagem Puma 1.24
LG Fathom 0.77 Samsung Fascinate 0.57
LG Optimus Vu 0.462 Samsung Infuse 4G 0.2
Motorola Cliq XT 1.36 Samsung Nexus S 0.51
Motorola Droid Pro 1.39 Samsung Replenish 0.3
Motorola Droid Razr M 1.3 Sony W518a Walkman 0.73
Nokia 7705 Twist 0.7 ZTE C79 0.869

x ¯ = 0.940

  α 2 = 1 C L 2 = 1 0.93 2 = 0.035

Z 0.035 = 1.812

E B M = ( z 0.035 ) ( σ n ) = ( 1.812 ) ( 0.337 20 ) = 0.1365

x ¯ EBM = 0.940 – 0.1365 = 0.8035

x ¯ + EBM = 0.940 + 0.1365 = 1.0765

We estimate with 93% confidence that the true SAR mean for the population of cell phones in the United States is between 0.8035 and 1.0765 watts per kilogram.

Got questions? Get instant answers now!

Notice the difference in the confidence intervals calculated in [link] and the following Try It exercise. These intervals are different for several reasons: they were calculated from different samples, the samples were different sizes, and the intervals were calculated for different levels of confidence. Even though the intervals are different, they do not yield conflicting information. The effects of these kinds of changes are the subject of the next section in this chapter.

Changing the confidence level or sample size

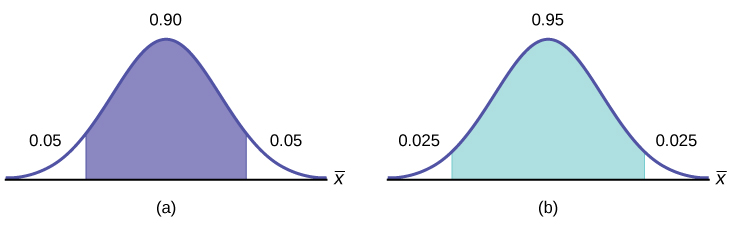
Suppose we change the original problem in [link] by using a 95% confidence level. Find a 95% confidence interval for the true (population) mean statistics exam score.

To find the confidence interval, you need the sample mean, x ¯ , and the EBM .

  • x ¯ = 68
  • EBM = ( z α 2 ) ( σ n )
  • σ = 3; n = 36; The confidence level is 95% ( CL = 0.95).

CL = 0.95 so α = 1 – CL = 1 – 0.95 = 0.05

α 2 = 0.025 z α 2 = z 0.025

The area to the right of z 0.025 is 0.025 and the area to the left of z 0.025 is 1 – 0.025 = 0.975.

z α 2 = z 0.025 = 1.96

when using invnorm(0.975,0,1) on the TI-83, 83+, or 84+ calculators. (This can also be found using appropriate commands on other calculators, using a computer, or using a probability table for the standard normal distribution.)

EBM = (1.96) ( 3 36 ) = 0.98

x ¯ EBM = 68 – 0.98 = 67.02

x ¯ + EBM = 68 + 0.98 = 68.98

Notice that the EBM is larger for a 95% confidence level in the original problem.

Interpretation

We estimate with 95% confidence that the true population mean for all statistics exam scores is between 67.02 and 68.98.

Explanation of 95% confidence level

Ninety-five percent of all confidence intervals constructed in this way contain the true value of the population mean statistics exam score.

Comparing the results

The 90% confidence interval is (67.18, 68.82). The 95% confidence interval is (67.02, 68.98). The 95% confidence interval is wider. If you look at the graphs, because the area 0.95 is larger than the area 0.90, it makes sense that the 95% confidence interval is wider. To be more confident that the confidence interval actually does contain the true value of the population mean for all statistics exam scores, the confidence interval necessarily needs to be wider.

Part (a) shows a normal distribution curve. A central region with area equal to 0.90 is shaded. Each unshaded tail of the curve has area equal to 0.05. Part (b) shows a normal distribution curve. A central region with area equal to 0.95 is shaded. Each unshaded tail of the curve has area equal to 0.025.

    Summary: Effect of Changing the Confidence Level

  • Increasing the confidence level increases the error bound, making the confidence interval wider.
  • Decreasing the confidence level decreases the error bound, making the confidence interval narrower.
Got questions? Get instant answers now!

Questions & Answers

What is inflation
Bright Reply
a general and ongoing rise in the level of prices in an economy
AI-Robot
What are the factors that affect demand for a commodity
Florence Reply
differentiate between demand and supply giving examples
Lambiv Reply
differentiated between demand and supply using examples
Lambiv
what is labour ?
Lambiv
how will I do?
Venny Reply
how is the graph works?I don't fully understand
Rezat Reply
information
Eliyee
devaluation
Eliyee
t
WARKISA
hi guys good evening to all
Lambiv
multiple choice question
Aster Reply
appreciation
Eliyee
explain perfect market
Lindiwe Reply
In economics, a perfect market refers to a theoretical construct where all participants have perfect information, goods are homogenous, there are no barriers to entry or exit, and prices are determined solely by supply and demand. It's an idealized model used for analysis,
Ezea
What is ceteris paribus?
Shukri Reply
other things being equal
AI-Robot
When MP₁ becomes negative, TP start to decline. Extuples Suppose that the short-run production function of certain cut-flower firm is given by: Q=4KL-0.6K2 - 0.112 • Where is quantity of cut flower produced, I is labour input and K is fixed capital input (K-5). Determine the average product of lab
Kelo
Extuples Suppose that the short-run production function of certain cut-flower firm is given by: Q=4KL-0.6K2 - 0.112 • Where is quantity of cut flower produced, I is labour input and K is fixed capital input (K-5). Determine the average product of labour (APL) and marginal product of labour (MPL)
Kelo
yes,thank you
Shukri
Can I ask you other question?
Shukri
what is monopoly mean?
Habtamu Reply
What is different between quantity demand and demand?
Shukri Reply
Quantity demanded refers to the specific amount of a good or service that consumers are willing and able to purchase at a give price and within a specific time period. Demand, on the other hand, is a broader concept that encompasses the entire relationship between price and quantity demanded
Ezea
ok
Shukri
how do you save a country economic situation when it's falling apart
Lilia Reply
what is the difference between economic growth and development
Fiker Reply
Economic growth as an increase in the production and consumption of goods and services within an economy.but Economic development as a broader concept that encompasses not only economic growth but also social & human well being.
Shukri
production function means
Jabir
What do you think is more important to focus on when considering inequality ?
Abdisa Reply
any question about economics?
Awais Reply
sir...I just want to ask one question... Define the term contract curve? if you are free please help me to find this answer 🙏
Asui
it is a curve that we get after connecting the pareto optimal combinations of two consumers after their mutually beneficial trade offs
Awais
thank you so much 👍 sir
Asui
In economics, the contract curve refers to the set of points in an Edgeworth box diagram where both parties involved in a trade cannot be made better off without making one of them worse off. It represents the Pareto efficient allocations of goods between two individuals or entities, where neither p
Cornelius
In economics, the contract curve refers to the set of points in an Edgeworth box diagram where both parties involved in a trade cannot be made better off without making one of them worse off. It represents the Pareto efficient allocations of goods between two individuals or entities,
Cornelius
Suppose a consumer consuming two commodities X and Y has The following utility function u=X0.4 Y0.6. If the price of the X and Y are 2 and 3 respectively and income Constraint is birr 50. A,Calculate quantities of x and y which maximize utility. B,Calculate value of Lagrange multiplier. C,Calculate quantities of X and Y consumed with a given price. D,alculate optimum level of output .
Feyisa Reply
Answer
Feyisa
c
Jabir
Got questions? Join the online conversation and get instant answers!
Jobilize.com Reply

Get Jobilize Job Search Mobile App in your pocket Now!

Get it on Google Play Download on the App Store Now


Source:  OpenStax, Introductory statistics. OpenStax CNX. May 06, 2016 Download for free at http://legacy.cnx.org/content/col11562/1.18
Google Play and the Google Play logo are trademarks of Google Inc.

Notification Switch

Would you like to follow the 'Introductory statistics' conversation and receive update notifications?

Ask