-
Home
- Introductory statistics
- Descriptive statistics
- Measures of the spread of the
where
Use the following information to answer the next two exercises : The following data are the distances between 20 retail stores and a large distribution center. The distances are in miles.
29; 37; 38; 40; 58; 67; 68; 69; 76; 86; 87; 95; 96; 96; 99; 106; 112; 127; 145; 150
Two baseball players, Fredo and Karl, on different teams wanted to find out who had the higher batting average when compared to his team. Which baseball player had the higher batting average when compared to his team?
| Baseball Player |
Batting Average |
Team Batting Average |
Team Standard Deviation |
| Fredo |
0.158 |
0.166 |
0.012 |
| Karl |
0.177 |
0.189 |
0.015 |
For Fredo:
z =
= –0.67
For Karl:
z =
= –0.8
Fredo’s
z -score of –0.67 is higher than Karl’s
z -score of –0.8. For batting average, higher values are better, so Fredo has a better batting average compared to his team.
Got questions? Get instant answers now!
Find the standard deviation for the following frequency tables using the formula. Check the calculations with the TI 83/84 .
Find the standard deviation for the following frequency tables using the formula. Check the calculations with the TI 83/84.
-
| Grade |
Frequency |
| 49.5–59.5 |
2 |
| 59.5–69.5 |
3 |
| 69.5–79.5 |
8 |
| 79.5–89.5 |
12 |
| 89.5–99.5 |
5 |
-
| Daily Low Temperature |
Frequency |
| 49.5–59.5 |
53 |
| 59.5–69.5 |
32 |
| 69.5–79.5 |
15 |
| 79.5–89.5 |
1 |
| 89.5–99.5 |
0 |
-
| Points per Game |
Frequency |
| 49.5–59.5 |
14 |
| 59.5–69.5 |
32 |
| 69.5–79.5 |
15 |
| 79.5–89.5 |
23 |
| 89.5–99.5 |
2 |
-
-
-
Got questions? Get instant answers now!
Bringing it together
Twenty-five randomly selected students were asked the number of movies they watched the previous week. The results are as follows:
| # of movies |
Frequency |
| 0 |
5 |
| 1 |
9 |
| 2 |
6 |
| 3 |
4 |
| 4 |
1 |
- Find the sample mean
.
- Find the approximate sample standard deviation,
s .
Got questions? Get instant answers now!
Forty randomly selected students were asked the number of pairs of sneakers they owned. Let
X = the number of pairs of sneakers owned. The results are as follows:
|
X |
Frequency |
| 1 |
2 |
| 2 |
5 |
| 3 |
8 |
| 4 |
12 |
| 5 |
12 |
| 6 |
0 |
| 7 |
1 |
- Find the sample mean
- Find the sample standard deviation,
s
- Construct a histogram of the data.
- Complete the columns of the chart.
- Find the first quartile.
- Find the median.
- Find the third quartile.
- Construct a box plot of the data.
- What percent of the students owned at least five pairs?
- Find the 40
th percentile.
- Find the 90
th percentile.
- Construct a line graph of the data
- Construct a stemplot of the data
Got questions? Get instant answers now!
Following are the published weights (in pounds) of all of the team members of the San Francisco 49ers from a previous year.
177; 205; 210; 210; 232; 205; 185; 185; 178; 210; 206; 212; 184; 174; 185; 242; 188; 212; 215; 247; 241; 223; 220; 260; 245; 259; 278; 270; 280; 295; 275; 285; 290; 272; 273; 280; 285; 286; 200; 215; 185; 230; 250; 241; 190; 260; 250; 302; 265; 290; 276; 228; 265
- Organize the data from smallest to largest value.
- Find the median.
- Find the first quartile.
- Find the third quartile.
- Construct a box plot of the data.
- The middle 50% of the weights are from _______ to _______.
- If our population were all professional football players, would the above data be a sample of weights or the population of weights? Why?
- If our population included every team member who ever played for the San Francisco 49ers, would the above data be a sample of weights or the population of weights? Why?
- Assume the population was the San Francisco 49ers. Find:
- the population mean,
μ .
- the population standard deviation,
σ .
- the weight that is two standard deviations below the mean.
- When Steve Young, quarterback, played football, he weighed 205 pounds. How many standard deviations above or below the mean was he?
- That same year, the mean weight for the Dallas Cowboys was 240.08 pounds with a standard deviation of 44.38 pounds. Emmit Smith weighed in at 209 pounds. With respect to his team, who was lighter, Smith or Young? How did you determine your answer?
- 174; 177; 178; 184; 185; 185; 185; 185; 188; 190; 200; 205; 205; 206; 210; 210; 210; 212; 212; 215; 215; 220; 223; 228; 230; 232; 241; 241; 242; 245; 247; 250; 250; 259; 260; 260; 265; 265; 270; 272; 273; 275; 276; 278; 280; 280; 285; 285; 286; 290; 290; 295; 302
- 241
- 205.5
- 272.5
-
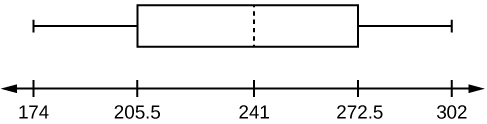
- 205.5, 272.5
- sample
- population
-
- 236.34
- 37.50
- 161.34
- 0.84 std. dev. below the mean
- Young
Got questions? Get instant answers now!
Questions & Answers
differentiate between demand and supply
giving examples
differentiated between demand and supply using examples
Lambiv
how is the graph works?I don't fully understand
hi guys good evening to all
Lambiv
In economics, a perfect market refers to a theoretical construct where all participants have perfect information, goods are homogenous, there are no barriers to entry or exit, and prices are determined solely by supply and demand. It's an idealized model used for analysis,
Ezea
other things being equal
AI-Robot
When MP₁ becomes negative, TP start to decline.
Extuples Suppose that the short-run production function of certain cut-flower firm is given by: Q=4KL-0.6K2 - 0.112 •
Where is quantity of cut flower produced, I is labour input and K is fixed capital input (K-5). Determine the average product of lab
Kelo
Extuples Suppose that the short-run production function of certain cut-flower firm is given by: Q=4KL-0.6K2 - 0.112 •
Where is quantity of cut flower produced, I is labour input and K is fixed capital input (K-5). Determine the average product of labour (APL) and marginal product of labour (MPL)
Kelo
Can I ask you other question?
Shukri
What is different between quantity demand and demand?
Quantity demanded refers to the specific amount of a good or service that consumers are willing and able to purchase at a give price and within a specific time period. Demand, on the other hand, is a broader concept that encompasses the entire relationship between price and quantity demanded
Ezea
how do you save a country economic situation when it's falling apart
what is the difference between economic growth and development
Economic growth as an increase in the production and consumption of goods and services within an economy.but
Economic development as a broader concept that encompasses not only economic growth but also social & human well being.
Shukri
production function means
Jabir
What do you think is more important to focus on when considering inequality ?
any question about economics?
sir...I just want to ask one question... Define the term contract curve? if you are free please help me to find this answer 🙏
Asui
it is a curve that we get after connecting the pareto optimal combinations of two consumers after their mutually beneficial trade offs
Awais
thank you so much 👍 sir
Asui
In economics, the contract curve refers to the set of points in an Edgeworth box diagram where both parties involved in a trade cannot be made better off without making one of them worse off. It represents the Pareto efficient allocations of goods between two individuals or entities, where neither p
Cornelius
In economics, the contract curve refers to the set of points in an Edgeworth box diagram where both parties involved in a trade cannot be made better off without making one of them worse off. It represents the Pareto efficient allocations of goods between two individuals or entities,
Cornelius
Suppose a consumer consuming two commodities X and Y has
The following utility function u=X0.4 Y0.6. If the price of the X and Y are 2 and 3 respectively and income Constraint is birr 50.
A,Calculate quantities of x and y which maximize utility.
B,Calculate value of Lagrange multiplier.
C,Calculate quantities of X and Y consumed with a given price.
D,alculate optimum level of output .
the market for lemon has 10 potential consumers, each having an individual demand curve p=101-10Qi, where p is price in dollar's per cup and Qi is the number of cups demanded per week by the i th consumer.Find the market demand curve using algebra. Draw an individual demand curve and the market dema
suppose the production function is given by ( L, K)=L¼K¾.assuming capital is fixed find APL and MPL. consider the following short run production function:Q=6L²-0.4L³ a) find the value of L that maximizes output b)find the value of L that maximizes marginal product
Abdureman
What is the difference between perfect competition and monopolistic competition?
Mohammed
Got questions? Join the online conversation and get instant answers!
Source:
OpenStax, Introductory statistics. OpenStax CNX. May 06, 2016 Download for free at http://legacy.cnx.org/content/col11562/1.18
Google Play and the Google Play logo are trademarks of Google Inc.


