

| << Chapter < Page | Chapter >> Page > |
Joon believes that 50% of first-time brides in the United States are younger than their grooms. She performs a hypothesis test to determine if the percentage is the same or different from 50% . Joon samples 100 first-time brides and 53 reply that they are younger than their grooms. For the hypothesis test, she uses a 1% level of significance.
Set up the hypothesis test:
The 1% level of significance means that α = 0.01. This is a test of a single population proportion .
H 0 : p = 0.50 H a : p ≠ 0.50
The words "is the same or different from" tell you this is a two-tailed test.
Calculate the distribution needed:
Random variable: P′ = the percent of of first-time brides who are younger than their grooms.
Distribution for the test: The problem contains no mention of a mean. The information is given in terms of percentages. Use the distribution for P′ , the estimated proportion.
Therefore,
where p = 0.50, q = 1− p = 0.50, and n = 100
Calculate the p -value using the normal distribution for proportions:
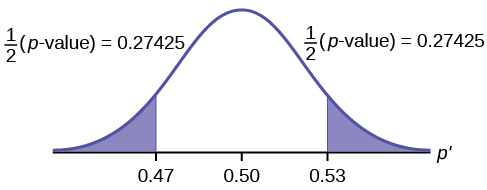
p -value = P ( p′ <0.47 or p′ >0.53) = 0.5485
where x = 53, p′ = = 0.53.
Interpretation of the p -value: If the null hypothesis is true, there is 0.5485 probability (54.85%) that the sample (estimated) proportion is 0.53 or more OR 0.47 or less (see the graph in [link] ).
μ = p = 0.50 comes from H 0 , the null hypothesis.
p′ = 0.53. Since the curve is symmetrical and the test is two-tailed, the p′ for the left tail is equal to 0.50 – 0.03 = 0.47 where μ = p = 0.50. (0.03 is the difference between 0.53 and 0.50.)
Compare α and the p -value:
Since α = 0.01 and p -value = 0.5485. α < p -value.
Make a decision: Since α < p -value, you cannot reject H 0 .
Conclusion: At the 1% level of significance, the sample data do not show sufficient evidence that the percentage of first-time brides who are younger than their grooms is different from 50%.
The p -value can easily be calculated.
Press
STAT and arrow over to
TESTS . Press
5:1-PropZTest . Enter .5 for
p
0 , 53 for
x and 100 for
n . Arrow down to
Prop and arrow to
not equals
p
0 . Press
ENTER . Arrow down to
Calculate and press
ENTER . The calculator calculates the
p -value (
p = 0.5485) and the test statistic (
z -score).
Prop not equals .5 is the alternate hypothesis. Do this set of instructions again except arrow to
Draw (instead of
Calculate ). Press
ENTER . A shaded graph appears with
z = 0.6 (test statistic) and
p = 0.5485 (
p -value). Make sure when you use
Draw that no other equations are highlighted in
Y = and the plots are turned off.
The Type I and Type II errors are as follows:
The Type I error is to conclude that the proportion of first-time brides who are younger than their grooms is different from 50% when, in fact, the proportion is actually 50%. (Reject the null hypothesis when the null hypothesis is true).
The Type II error is there is not enough evidence to conclude that the proportion of first time brides who are younger than their grooms differs from 50% when, in fact, the proportion does differ from 50%. (Do not reject the null hypothesis when the null hypothesis is false.)
A teacher believes that 85% of students in the class will want to go on a field trip to the local zoo. She performs a hypothesis test to determine if the percentage is the same or different from 85%. The teacher samples 50 students and 39 reply that they would want to go to the zoo. For the hypothesis test, use a 1% level of significance.
First, determine what type of test this is, set up the hypothesis test, find the p -value, sketch the graph, and state your conclusion.
Since the problem is about percentages, this is a test of single population proportions.
H 0 : p = 0.85
H a : p ≠ 0.85
p = 0.7554
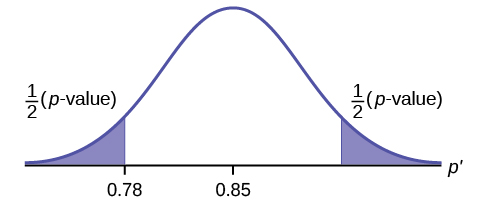
Because p > α , we fail to reject the null hypothesis. There is not sufficient evidence to suggest that the proportion of students that want to go to the zoo is not 85%.
Notification Switch
Would you like to follow the 'Introductory statistics' conversation and receive update notifications?

|
|
|
|
|

|
|

|
|

|
|

|
|

|
|

|
|

|
|

|
|
|
|
|

|