The student will calculate the 90% confidence interval for the mean cost of a home in the area in which this school is located.
The student will interpret confidence intervals.
The student will determine the effects of changing conditions on the confidence interval.
Collect the data
Check the Real Estate section in your local newspaper. Record the sale prices for 35 randomly selected homes recently listed in the county.
Note
Many newspapers list them only one day per week. Also, we will assume that homes come up for sale randomly.
Complete the table:
__________
__________
__________
__________
__________
__________
__________
__________
__________
__________
__________
__________
__________
__________
__________
__________
__________
__________
__________
__________
__________
__________
__________
__________
__________
__________
__________
__________
__________
__________
__________
__________
__________
__________
__________
Describe the data
Compute the following:
= _____
= _____
n = _____
In words, define the random variable
.
State the estimated distribution to use. Use both words and symbols.
Find the confidence interval
Calculate the confidence interval and the error bound.
Confidence Interval: _____
Error Bound: _____
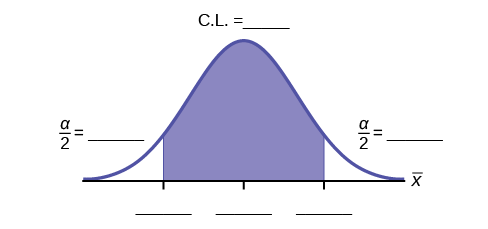
How much area is in both tails (combined)?
α = _____
How much area is in each tail?
= _____
Fill in the blanks on the graph with the area in each section. Then, fill in the number
line with the upper and lower limits of the confidence interval and the sample mean.
Some students think that a 90% confidence interval contains 90% of the data. Use the list of data on the first page and count how many of the data values lie within the confidence interval. What percent is this? Is this percent close to 90%? Explain why this percent should or should not be close to 90%.
Describe the confidence interval
In two to three complete sentences, explain what a confidence interval means (in general), as if you were talking to someone who has not taken statistics.
In one to two complete sentences, explain what this confidence interval means for this particular study.
Use the data to construct confidence intervals
Using the given information, construct a confidence interval for each confidence level given.
Confidence level
EBM/Error Bound
Confidence Interval
50%
80%
95%
99%
What happens to the EBM as the confidence level increases? Does the width of the confidence interval increase or decrease? Explain why this happens.
Questions & Answers
differentiate between demand and supply
giving examples
In economics, a perfect market refers to a theoretical construct where all participants have perfect information, goods are homogenous, there are no barriers to entry or exit, and prices are determined solely by supply and demand. It's an idealized model used for analysis,
When MP₁ becomes negative, TP start to decline.
Extuples Suppose that the short-run production function of certain cut-flower firm is given by: Q=4KL-0.6K2 - 0.112 •
Where is quantity of cut flower produced, I is labour input and K is fixed capital input (K-5). Determine the average product of lab
Kelo
Extuples Suppose that the short-run production function of certain cut-flower firm is given by: Q=4KL-0.6K2 - 0.112 •
Where is quantity of cut flower produced, I is labour input and K is fixed capital input (K-5). Determine the average product of labour (APL) and marginal product of labour (MPL)
Quantity demanded refers to the specific amount of a good or service that consumers are willing and able to purchase at a give price and within a specific time period. Demand, on the other hand, is a broader concept that encompasses the entire relationship between price and quantity demanded
Ezea
ok
Shukri
how do you save a country economic situation when it's falling apart
Economic growth as an increase in the production and consumption of goods and services within an economy.but
Economic development as a broader concept that encompasses not only economic growth but also social & human well being.
Shukri
production function means
Jabir
What do you think is more important to focus on when considering inequality ?
sir...I just want to ask one question... Define the term contract curve? if you are free please help me to find this answer 🙏
Asui
it is a curve that we get after connecting the pareto optimal combinations of two consumers after their mutually beneficial trade offs
Awais
thank you so much 👍 sir
Asui
In economics, the contract curve refers to the set of points in an Edgeworth box diagram where both parties involved in a trade cannot be made better off without making one of them worse off. It represents the Pareto efficient allocations of goods between two individuals or entities, where neither p
Cornelius
In economics, the contract curve refers to the set of points in an Edgeworth box diagram where both parties involved in a trade cannot be made better off without making one of them worse off. It represents the Pareto efficient allocations of goods between two individuals or entities,
Cornelius
Suppose a consumer consuming two commodities X and Y has
The following utility function u=X0.4 Y0.6. If the price of the X and Y are 2 and 3 respectively and income Constraint is birr 50.
A,Calculate quantities of x and y which maximize utility.
B,Calculate value of Lagrange multiplier.
C,Calculate quantities of X and Y consumed with a given price.
D,alculate optimum level of output .
the market for lemon has 10 potential consumers, each having an individual demand curve p=101-10Qi, where p is price in dollar's per cup and Qi is the number of cups demanded per week by the i th consumer.Find the market demand curve using algebra. Draw an individual demand curve and the market dema
suppose the production function is given by ( L, K)=L¼K¾.assuming capital is fixed find APL and MPL. consider the following short run production function:Q=6L²-0.4L³ a) find the value of L that maximizes output b)find the value of L that maximizes marginal product