

| << Chapter < Page | Chapter >> Page > |
Identify the following:
In words, define the random variable X .
In words, define the random variable .
is the mean weight of a sample of 20 heads of lettuce.
Which distribution should you use for this problem?
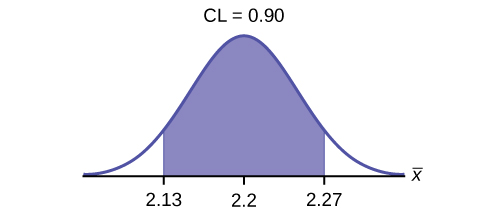
Construct a 90% confidence interval for the population mean weight of the heads of lettuce. State the confidence interval, sketch the graph, and calculate the error bound.
EBM = 0.07
CI: (2.1264, 2.2736)
Construct a 95% confidence interval for the population mean weight of the heads of lettuce. State the confidence interval, sketch the graph, and calculate the error bound.
The interval is greater because the level of confidence increased. If the only change made in the analysis is a change in confidence level, then all we are doing is changing how much area is being calculated for the normal distribution. Therefore, a larger confidence level results in larger areas and larger intervals.
In complete sentences, give an interpretation of what the interval in [link] means.
What would happen if 40 heads of lettuce were sampled instead of 20, and the error bound remained the same?
The confidence level would increase.
What would happen if 40 heads of lettuce were sampled instead of 20, and the confidence level remained the same?
Use the following information to answer the next 14 exercises: The mean age for all Foothill College students for a recent Fall term was 33.2. The population standard deviation has been pretty consistent at 15. Suppose that twenty-five Winter students were randomly selected. The mean age for the sample was 30.4. We are interested in the true mean age for Winter Foothill College students. Let
X = the age of a Winter Foothill College student.
n = _____
In words, define the random variable .
Is known?
As a result of your answer to [link] , state the exact distribution to use when calculating the confidence interval.
normal
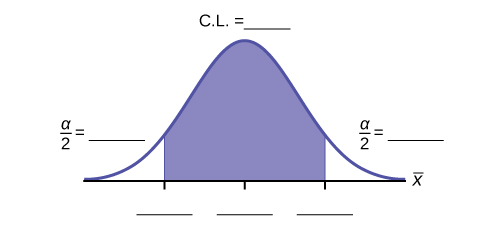
Construct a 95% Confidence Interval for the true mean age of Winter Foothill College students by working out then answering the next seven exercises .
How much area is in both tails (combined)? α =________
Identify the following specifications:
The 95% confidence interval is:__________________.
(24.52,36.28)
Fill in the blanks on the graph with the areas, upper and lower limits of the confidence interval, and the sample mean.
In one complete sentence, explain what the interval means.
We are 95% confident that the true mean age for Winger Foothill College students is between 24.52 and 36.28.
Using the same mean, standard deviation, and level of confidence, suppose that n were 69 instead of 25. Would the error bound become larger or smaller? How do you know?
Using the same mean, standard deviation, and sample size, how would the error bound change if the confidence level were reduced to 90%? Why?
The error bound for the mean would decrease because as the CL decreases, you need less area under the normal curve (which translates into a smaller interval) to capture the true population mean.
Notification Switch
Would you like to follow the 'Introductory statistics' conversation and receive update notifications?

|
|
|
|
|

|
|

|
|

|
|

|
|

|
|

|
|

|
|

|
|

|
|

|