

| << Chapter < Page | Chapter >> Page > |
A confidence interval for a population mean with a known standard deviation is based on the fact that the sample means follow an approximately normal distribution. Suppose that our sample has a mean of and we have constructed the 90% confidence interval (5, 15) where EBM = 5.
To construct a confidence interval for a single unknown population mean μ , where the population standard deviation is known , we need as an estimate for μ and we need the margin of error. Here, the margin of error ( EBM ) is called the error bound for a population mean (abbreviated EBM ). The sample mean is the point estimate of the unknown population mean μ .
The confidence interval estimate will have the form:
(point estimate - error bound, point estimate + error bound) or, in symbols,( )
The margin of error ( EBM ) depends on the confidence level (abbreviated CL ). The confidence level is often considered the probability that the calculated confidence interval estimate will contain the true population parameter. However, it is more accurate to state that the confidence level is the percent of confidence intervals that contain the true population parameter when repeated samples are taken. Most often, it is the choice of the person constructing the confidence interval to choose a confidence level of 90% or higher because that person wants to be reasonably certain of his or her conclusions.
There is another probability called alpha (
α ).
α is related to the confidence level,
CL .
α is the probability that the interval does not contain the unknown population parameter.
Mathematically,
α +
CL = 1.
= 7 and EBM = 2.5
The confidence interval is (7 – 2.5, 7 + 2.5), and calculating the values gives (4.5, 9.5).
If the confidence level ( CL ) is 95%, then we say that, "We estimate with 95% confidence that the true value of the population mean is between 4.5 and 9.5."
Suppose we have data from a sample. The sample mean is 15, and the error bound for the mean is 3.2.
What is the confidence interval estimate for the population mean?
(11.8, 18.2)
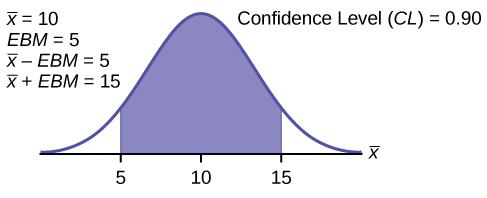
A confidence interval for a population mean with a known standard deviation is based on the fact that the sample means follow an approximately normal distribution. Suppose that our sample has a mean of = 10, and we have constructed the 90% confidence interval (5, 15) where EBM = 5.
To get a 90% confidence interval, we must include the central 90% of the probability of the normal distribution. If we include the central 90%, we leave out a total of α = 10% in both tails, or 5% in each tail, of the normal distribution.
To capture the central 90%, we must go out 1.645 "standard deviations" on either side of the calculated sample mean. The value 1.645 is the z -score from a standard normal probability distribution that puts an area of 0.90 in the center, an area of 0.05 in the far left tail, and an area of 0.05 in the far right tail.
Notification Switch
Would you like to follow the 'Introductory statistics' conversation and receive update notifications?

|
|

|
|

|
|

|
|

|
|

|
|

|
|
|
|
|

|
|

|
|

|