<< Chapter < Page Chapter >> Page >

You are president of an on-campus special events organization. You need a committee of seven students to plan a special birthday party for the president of the college. Your organization consists of 18 women and 15 men. You are interested in the number of men on your committee. If the members of the committee are randomly selected, what is the probability that your committee has more than four men?

This is a hypergeometric problem because you are choosing your committee from two groups (men and women).

a. Are you choosing with or without replacement?

a. without

Got questions? Get instant answers now!

b. What is the group of interest?

b. the men

Got questions? Get instant answers now!

c. How many are in the group of interest?

c. 15 men

Got questions? Get instant answers now!

d. How many are in the other group?

d. 18 women

Got questions? Get instant answers now!

e. Let X = _________ on the committee. What values does X take on?

e. Let X = the number of men on the committee. x = 0, 1, 2, …, 7.

Got questions? Get instant answers now!

f. The probability question is P (_______).

f. P ( x >4)

Got questions? Get instant answers now!

Try it

A palette has 200 milk cartons. Of the 200 cartons, it is known that ten of them have leaked and cannot be sold. A stock clerk randomly chooses 18 for inspection. He wants to know the probability that among the 18, no more than two are leaking. Give five reasons why this is a hypergeometric problem.

  1. There are two groups.
  2. You are concerned with a group of interest.
  3. You sample without replacement.
  4. Each pick is not independent.
  5. You are not dealing with Bernoulli Trials.
Got questions? Get instant answers now!

Notation for the hypergeometric: h = hypergeometric probability distribution function

X ~ H ( r , b , n )

Read this as " X is a random variable with a hypergeometric distribution." The parameters are r , b , and n ; r = the size of the group of interest (first group), b = the size of the second group, n = the size of the chosen sample.

A school site committee is to be chosen randomly from six men and five women. If the committee consists of four members chosen randomly, what is the probability that two of them are men? How many men do you expect to be on the committee?

Let X = the number of men on the committee of four. The men are the group of interest (first group).

X takes on the values 0, 1, 2, 3, 4, where r = 6 , b = 5 , and n = 4 . X ~ H (6, 5, 4)

Find P ( x = 2). P ( x = 2) = 0.4545 (calculator or computer)

Note

Currently, the TI-83+ and TI-84 do not have hypergeometric probability functions. There are a number of computer packages, including Microsoft Excel, that do.

The probability that there are two men on the committee is about 0.45.

The graph of X ~ H (6, 5, 4) is:

This graph shows a hypergeometric probability distribution. It has five bars that are slightly normally distributed. The x-axis shows values from 0 to 4 in increments of 1, representing the number of men on the four-person committee. The y-axis ranges from 0 to 0.5 in increments of 0.1.

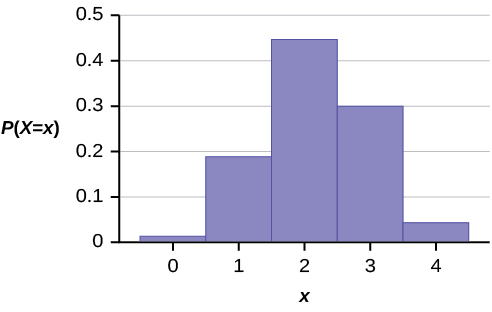
The y -axis contains the probability of X , where X = the number of men on the committee.

You would expect m = 2.18 (about two) men on the committee.

The formula for the mean is μ = n r r + b = ( 4 ) ( 6 ) 6 + 5 = 2.18

Got questions? Get instant answers now!

Try it

An intramural basketball team is to be chosen randomly from 15 boys and 12 girls. The team has ten slots. You want to know the probability that eight of the players will be boys. What is the group of interest and the sample?

The group of interest is the 15 boys. The sample consists of the ten slots on the intramural basketball team.

Got questions? Get instant answers now!

Chapter review

A hypergeometric experiment is a statistical experiment with the following properties:

  1. You take samples from two groups.
  2. You are concerned with a group of interest, called the first group.
  3. You sample without replacement from the combined groups.
  4. Each pick is not independent, since sampling is without replacement.
  5. You are not dealing with Bernoulli Trials.

The outcomes of a hypergeometric experiment fit a hypergeometric probability distribution. The random variable X = the number of items from the group of interest. The distribution of X is denoted X ~ H ( r , b , n ), where r = the size of the group of interest (first group), b = the size of the second group, and n = the size of the chosen sample. It follows that
n r + b . The mean of X is μ = n r r  +  b and the standard deviation is σ = r b n ( r  +  b  −  n ) ( r  +  b ) 2 ( r  +  b 1) .

Formula review

X ~ H ( r , b , n ) means that the discrete random variable X has a hypergeometric probability distribution with r = the size of the group of interest (first group), b = the size of the second group, and n = the size of the chosen sample.

X = the number of items from the group of interest that are in the chosen sample, and X may take on the values x = 0, 1, ..., up to the size of the group of interest. (The minimum value for X may be larger than zero in some instances.)

n r + b

The mean of X is given by the formula μ = n r r  +  b and the standard deviation is = r b n ( r  +  b n ) ( r  +  b ) 2 ( r  +  b 1) .

Use the following information to answer the next five exercises: Suppose that a group of statistics students is divided into two groups: business majors and non-business majors. There are 16 business majors in the group and seven non-business majors in the group. A random sample of nine students is taken. We are interested in the number of business majors in the sample.

In words, define the random variable X .

X = the number of business majors in the sample.

Got questions? Get instant answers now!

What values does X take on?

2, 3, 4, 5, 6, 7, 8, 9

Got questions? Get instant answers now!

Find the standard deviation.

Got questions? Get instant answers now!

On average ( μ ), how many would you expect to be business majors?

6.26

Got questions? Get instant answers now!

Questions & Answers

how do you get the 2/50
Abba Reply
number of sport play by 50 student construct discrete data
Aminu Reply
width of the frangebany leaves on how to write a introduction
Theresa Reply
Solve the mean of variance
Veronica Reply
Step 1: Find the mean. To find the mean, add up all the scores, then divide them by the number of scores. ... Step 2: Find each score's deviation from the mean. ... Step 3: Square each deviation from the mean. ... Step 4: Find the sum of squares. ... Step 5: Divide the sum of squares by n – 1 or N.
kenneth
what is error
Yakuba Reply
Is mistake done to something
Vutshila
Hy
anas
hy
What is the life teble
anas
hy
Jibrin
statistics is the analyzing of data
Tajudeen Reply
what is statics?
Zelalem Reply
how do you calculate mean
Gloria Reply
diveving the sum if all values
Shaynaynay
let A1,A2 and A3 events be independent,show that (A1)^c, (A2)^c and (A3)^c are independent?
Fisaye Reply
what is statistics
Akhisani Reply
data collected all over the world
Shaynaynay
construct a less than and more than table
Imad Reply
The sample of 16 students is taken. The average age in the sample was 22 years with astandard deviation of 6 years. Construct a 95% confidence interval for the age of the population.
Aschalew Reply
Bhartdarshan' is an internet-based travel agency wherein customer can see videos of the cities they plant to visit. The number of hits daily is a normally distributed random variable with a mean of 10,000 and a standard deviation of 2,400 a. what is the probability of getting more than 12,000 hits? b. what is the probability of getting fewer than 9,000 hits?
Akshay Reply
Bhartdarshan'is an internet-based travel agency wherein customer can see videos of the cities they plan to visit. The number of hits daily is a normally distributed random variable with a mean of 10,000 and a standard deviation of 2,400. a. What is the probability of getting more than 12,000 hits
Akshay
1
Bright
Sorry i want to learn more about this question
Bright
Someone help
Bright
a= 0.20233 b=0.3384
Sufiyan
a
Shaynaynay
How do I interpret level of significance?
Mohd Reply
It depends on your business problem or in Machine Learning you could use ROC- AUC cruve to decide the threshold value
Shivam
how skewness and kurtosis are used in statistics
Owen Reply
yes what is it
Taneeya

Get Jobilize Job Search Mobile App in your pocket Now!

Get it on Google Play Download on the App Store Now


Source:  OpenStax, Introductory statistics. OpenStax CNX. May 06, 2016 Download for free at http://legacy.cnx.org/content/col11562/1.18
Google Play and the Google Play logo are trademarks of Google Inc.

Notification Switch

Would you like to follow the 'Introductory statistics' conversation and receive update notifications?

Ask