

| << Chapter < Page | Chapter >> Page > |
Another of the uses of the F distribution is testing two variances. It is often desirable to compare two variances rather than two averages. For instance, collegeadministrators would like two college professors grading exams to have the same variation in their grading. In order for a lid to fit a container, the variation in the lidand the container should be the same. A supermarket might be interested in the variability of check-out times for two checkers.
In order to perform a F test of two variances, it is important that the following are true:
Suppose we sample randomly from two independent normal populations. Let and be the population variances and and be the sample variances. Let the sample sizes be and . Since we are interested in comparing the two sample variances, we use the F ratio
has the distribution ~
where are the degrees of freedom for the numerator and are the degrees of freedom for the denominator.
If the null hypothesis is , then the F-Ratio becomes .
If the two populations have equal variances, then and are close in value and is close to . But if the two population variances are very different, and tend to be very different, too.Choosing as the larger sample variance causes the ratio to be greater than . If and are far apart, then is a large number.
Therefore, if is close to , the evidence favors the null hypothesis (the two population variances are equal). But if is much larger than , then the evidence is against the null hypothesis.
A test of two variances may be left, right, or two-tailed.
Two college instructors are interested in whether or not there is any variation in the way they grade math exams. They each grade the same set of 30exams. The first instructor's grades have a variance of 52.3. The second instructor's grades have a variance of 89.9.
Test the claim that the first instructor's variance is smaller. (In most colleges, it is desirable for the variances of exam grades to be nearlythe same among instructors.) The level of significance is 10%.
Let 1 and 2 be the subscripts that indicate the first and second instructor, respectively.
.
: and :
Calculate the test statistic: By the null hypothesis , the F statistic is
Distribution for the test: where and .
Graph: This test is left tailed.
Draw the graph labeling and shading appropriately.
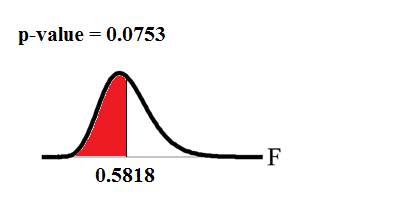
Probability statement: ( )
Compare and the p-value: .
Make a decision: Since , reject .
Conclusion: With a 10% level of significance, from the data, there is sufficient evidence to conclude that the variance in grades for the first instructor is smaller.
TI-83+ and TI-84: Press
STAT and arrow over to
TESTS . Arrow down to
D:2-SampFTest . Press
ENTER . Arrow to
Stats and press
ENTER . For
Sx1 ,
n1 ,
Sx2 , and
n2 , enter
,
30 ,
, and
30 . Press
ENTER after
each. Arrow to
σ1: and
σ2 . Press
ENTER . Arrow down to
Calculate and
press
ENTER .
and
. Do the procedure again
and try
Draw instead of
Calculate .
Notification Switch
Would you like to follow the 'Collaborative statistics' conversation and receive update notifications?

|
|

|
|

|
|
|
|
|

|
|

|
|

|
|
|
|
|

|
|
|
|