<< Chapter < Page Chapter >> Page >
This module states the factors associated with F Distributions and provides students with some examples to help further understand the concept. Students will be given the opportunity to see F Distributions in action through participation in an optional classroom exercise.
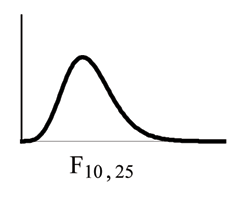
  1. The curve is not symmetrical but skewed to the right.
  2. There is a different curve for each set of dfs .
  3. The F statistic is greater than or equal to zero.
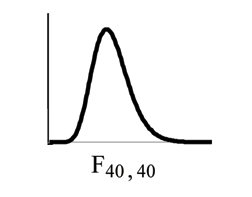
  4. As the degrees of freedom for the numerator and for the denominator get larger, the curve approximates the normal.
  5. Other uses for the F distribution include comparing two variances and Two-Way Analysis of Variance. Comparing two variances is discussed at the end of the chapter.Two-Way Analysis is mentioned for your information only.

Nonsymmetrical F distribution curve skewed to the right, more values in the right tail and the peak is closer to the left. This curve is different from the graph on the right because of the different dfs. Nonsymmetrical F distribution curve skewed to the right, more values in the right tail and the peak is closer to the left. This curve is different from the graph on the left because of the different dfs. Because its dfs are larger, it is closer in resemblance to a normal distribution curve.

One-Way ANOVA: Four sororities took a random sample of sisters regarding their grade means for the past term. The results are shown below:

MEAN GRADES FOR FOUR SORORITIES
Sorority 1 Sorority 2 Sorority 3 Sorority 4
2.17 2.63 2.63 3.79
1.85 1.77 3.78 3.45
2.83 3.25 4.00 3.08
1.69 1.86 2.55 2.26
3.33 2.21 2.45 3.18

Using a significance level of 1%, is there a difference in mean grades among the sororities?

Let μ 1 , μ 2 , μ 3 , μ 4 be the population means of the sororities. Remember that the null hypothesis claims that the sorority groups are from the same normal distribution.The alternate hypothesis says that at least two of the sorority groups come from populations with different normal distributions. Notice that the four sample sizes areeach size 5.

This is an example of a balanced design , since each factor (i.e. Sorority) has the same number of observations.

H o : μ 1 = μ 2 = μ 3 = μ 4

H a : Not all of the means μ 1 , μ 2 , μ 3 , μ 4 are equal.

Distribution for the test: F 3 , 16

where k = 4 groups and n = 20 samples in total

df(num) = k - 1 = 4 - 1 = 3

df(denom) = n - k = 20 - 4 = 16

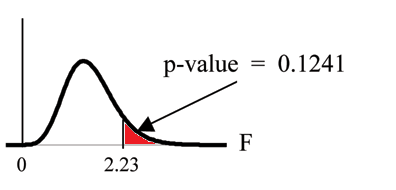
Calculate the test statistic: F = 2.23

Graph:

Nonsymmetrical F distribution curve with values of 0 and 2.23 on the x-axis representing the test statistic of sorority grade averages. A vertical upward line extends from 2.23 to the curve and the area to the right of this is equal to the p-value.

Probability statement: p-value = P ( F > 2.23 ) = 0.1241

Compare α and the p-value : α = 0.01 p-value = 0.1241 α < p-value

Make a decision: Since α < p-value , you cannot reject H o .

Conclusion: There is not sufficient evidence to conclude that there is a difference among the mean grades for the sororities.

TI-83+ or TI 84: Put the data into lists L1, L2, L3, and L4. Press STAT and arrow over to TESTS . Arrow down to F:ANOVA . Press ENTER and Enter ( L1,L2,L3,L4 ). The F statistic is 2.2303 and the p-value is 0.1241. df(numerator) = 3 (under "Factor" ) and df(denominator) = 16 (under Error ).

Got questions? Get instant answers now!

A fourth grade class is studying the environment. One of the assignments is to grow bean plants in different soils. Tommy chose to grow his beanplants in soil found outside his classroom mixed with dryer lint. Tara chose to grow her bean plants in potting soil bought at the local nursery. Nick chose to grow his beanplants in soil from his mother's garden. No chemicals were used on the plants, only water. They were grown inside the classroom next to a large window. Each childgrew 5 plants. At the end of the growing period, each plant was measured, producing the following data (in inches):

Tommy's Plants Tara's Plants Nick's Plants
24 25 23
21 31 27
23 23 22
30 20 30
23 28 20

Does it appear that the three media in which the bean plants were grown produce the same mean height? Test at a 3% level of significance.

This time, we will perform the calculations that lead to the F' statistic. Notice that each group has the same number of plants so we will use the formula F' = n s x _ 2 s 2 pooled .

First, calculate the sample mean and sample variance of each group.

Tommy's Plants Tara's Plants Nick's Plants
Sample Mean 24.2 25.4 24.4
Sample Variance 11.7 18.3 16.3

Next, calculate the variance of the three group means (Calculate the variance of 24.2, 25.4, and 24.4). Variance of the group means = 0.413 = s x 2

Then MS between = n s x 2 = ( 5 ) ( 0.413 ) where n = 5 is the sample size (number of plants each child grew).

Calculate the mean of the three sample variances (Calculate the mean of 11.7, 18.3, and 16.3). Mean of the sample variances = 15.433 = s 2 pooled size 12{ \( s rSub { size 8{ ital "pooled"} } \) rSup { size 8{2} } ={}} {}

Then MS within = s 2 pooled size 12{ \( s rSub { size 8{ ital "pooled"} } \) rSup { size 8{2} } ={}} {} = 15.433 .

The F statistic (or F ratio) is F = MS between MS within = n s x _ 2 s 2 pooled = ( 5 ) ( 0.413 ) 15.433 = 0.134

The dfs for the numerator = the number of groups - 1 = 3 - 1 = 2

The dfs for the denominator = the total number of samples - the number of groups = 15 - 3 = 12

The distribution for the test is F 2 , 12 and the F statistic is F = 0.134

The p-value is P ( F > 0.134 ) = 0.8759 .

Decision: Since α = 0.03 and the p-value = 0.8759 , do not reject H o . (Why?)

Conclusion: With a 3% the level of significance, from the sample data, the evidence is not sufficient to conclude that the mean heights of the bean plants are different.

(This experiment was actually done by three classmates of the son of one of the authors.)

Got questions? Get instant answers now!

Another fourth grader also grew bean plants but this time in a jelly-like mass. The heights were (in inches) 24, 28, 25, 30, and 32.

Do a One-Way ANOVA test on the 4 groups. You may use your calculator or computer to perform the test. Are the heights of the bean plants different? Use a solution sheet .

  • F = 0.9496
  • p-value = 0.4402

From the sample data, the evidence is not sufficient to conclude that the mean heights of the bean plants are different.

Got questions? Get instant answers now!

Optional classroom activity

From the class, create four groups of the same size as follows: men under 22, men at least 22, women under 22, women at least 22. Have each member of each group record the number of states in the United States he or she has visited.Run an ANOVA test to determine if the average number of states visited in the four groups are the same. Test at a 1% level of significance. Use one of the solution sheets at the end of the chapter (after the homework).

Questions & Answers

how to study physic and understand
Ewa Reply
what is conservative force with examples
Moses
what is work
Fredrick Reply
the transfer of energy by a force that causes an object to be displaced; the product of the component of the force in the direction of the displacement and the magnitude of the displacement
AI-Robot
why is it from light to gravity
Esther Reply
difference between model and theory
Esther
Is the ship moving at a constant velocity?
Kamogelo Reply
The full note of modern physics
aluet Reply
introduction to applications of nuclear physics
aluet Reply
the explanation is not in full details
Moses Reply
I need more explanation or all about kinematics
Moses
yes
zephaniah
I need more explanation or all about nuclear physics
aluet
Show that the equal masses particles emarge from collision at right angle by making explicit used of fact that momentum is a vector quantity
Muhammad Reply
yh
Isaac
A wave is described by the function D(x,t)=(1.6cm) sin[(1.2cm^-1(x+6.8cm/st] what are:a.Amplitude b. wavelength c. wave number d. frequency e. period f. velocity of speed.
Majok Reply
what is frontier of physics
Somto Reply
A body is projected upward at an angle 45° 18minutes with the horizontal with an initial speed of 40km per second. In hoe many seconds will the body reach the ground then how far from the point of projection will it strike. At what angle will the horizontal will strike
Gufraan Reply
Suppose hydrogen and oxygen are diffusing through air. A small amount of each is released simultaneously. How much time passes before the hydrogen is 1.00 s ahead of the oxygen? Such differences in arrival times are used as an analytical tool in gas chromatography.
Ezekiel Reply
please explain
Samuel
what's the definition of physics
Mobolaji Reply
what is physics
Nangun Reply
the science concerned with describing the interactions of energy, matter, space, and time; it is especially interested in what fundamental mechanisms underlie every phenomenon
AI-Robot
what is isotopes
Nangun Reply
nuclei having the same Z and different N s
AI-Robot
Got questions? Join the online conversation and get instant answers!
Jobilize.com Reply

Get Jobilize Job Search Mobile App in your pocket Now!

Get it on Google Play Download on the App Store Now


Source:  OpenStax, Collaborative statistics. OpenStax CNX. Jul 03, 2012 Download for free at http://cnx.org/content/col10522/1.40
Google Play and the Google Play logo are trademarks of Google Inc.

Notification Switch

Would you like to follow the 'Collaborative statistics' conversation and receive update notifications?

Ask