<< Chapter < Page Chapter >> Page >

The notation for the chi-square distribution is:

χ χ d f 2


where df = degrees of freedom which depends on how chi-square is being used. (If you want to practice calculating chi-square probabilities then use df = n - 1. The degrees of freedom for the three major uses are each calculated differently.)

For the χ 2 distribution, the population mean is μ = df and the population standard deviation is σ = 2 ( d f ) .

The random variable is shown as χ 2 , but may be any upper case letter.

The random variable for a chi-square distribution with k degrees of freedom is the sum of k independent, squared standard normal variables.

χ 2 = ( Z 1 ) 2 + ( Z 2 ) 2 + ... + ( Z k ) 2

  1. The curve is nonsymmetrical and skewed to the right.
  2. There is a different chi-square curve for each df .
    Part (a) shows a chi-square curve with 2 degrees of freedom. It is nonsymmetrical and slopes downward continually. Part (b) shows a chi-square curve with 24 df. This nonsymmetrical curve does have a peak and is skewed to the right. The graphs illustrate that different degrees of freedom produce different chi-square curves.
  3. The test statistic for any test is always greater than or equal to zero.
  4. When df >90, the chi-square curve approximates the normal distribution. For X ~ χ 1,000 2 the mean, μ = df = 1,000 and the standard deviation, σ = 2 ( 1,000 ) = 44.7. Therefore, X ~ N (1,000, 44.7), approximately.
  5. The mean, μ , is located just to the right of the peak.
    This is a nonsymmetrical chi-square curve which is skewed to the right. The mean, m, is labeled on the horizontal axis and is located to the right of the curve's peak.

References

Data from Parade Magazine .

“HIV/AIDS Epidemiology Santa Clara County.”Santa Clara County Public Health Department, May 2011.

Chapter review

The chi-square distribution is a useful tool for assessment in a series of problem categories. These problem categories include primarily (i) whether a data set fits a particular distribution, (ii) whether the distributions of two populations are the same, (iii) whether two events might be independent, and (iv) whether there is a different variability than expected within a population.

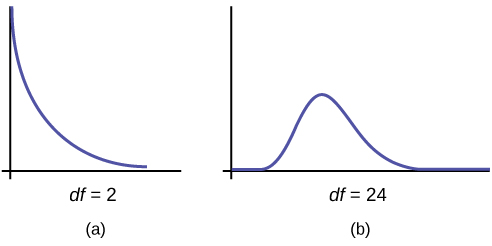
An important parameter in a chi-square distribution is the degrees of freedom df in a given problem. The random variable in the chi-square distribution is the sum of squares of df standard normal variables, which must be independent. The key characteristics of the chi-square distribution also depend directly on the degrees of freedom.

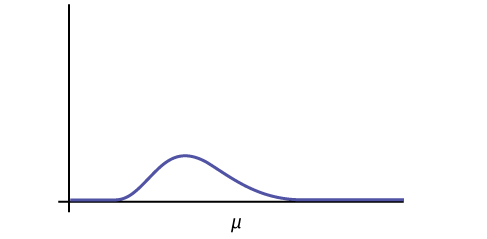
The chi-square distribution curve is skewed to the right, and its shape depends on the degrees of freedom df . For df >90, the curve approximates the normal distribution. Test statistics based on the chi-square distribution are always greater than or equal to zero. Such application tests are almost always right-tailed tests.

Formula review

χ 2 = ( Z 1 ) 2 + ( Z 2 ) 2 + … ( Z df ) 2 chi-square distribution random variable

μ χ 2 = df chi-square distribution population mean

σ χ 2 = 2 ( d f ) Chi-Square distribution population standard deviation

If the number of degrees of freedom for a chi-square distribution is 25, what is the population mean and standard deviation?

mean = 25 and standard deviation = 7.0711

Got questions? Get instant answers now!

If df >90, the distribution is _____________. If df = 15, the distribution is ________________.

Got questions? Get instant answers now!

When does the chi-square curve approximate a normal distribution?

when the number of degrees of freedom is greater than 90

Got questions? Get instant answers now!

Where is μ located on a chi-square curve?

Got questions? Get instant answers now!

Is it more likely the df is 90, 20, or two in the graph?
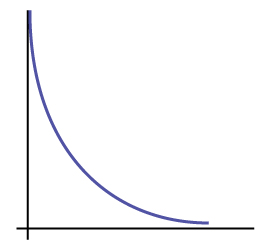
This is a nonsymmetrical  chi-square curve which slopes downward continually.

df = 2

Got questions? Get instant answers now!

Questions & Answers

how do you get the 2/50
Abba Reply
number of sport play by 50 student construct discrete data
Aminu Reply
width of the frangebany leaves on how to write a introduction
Theresa Reply
Solve the mean of variance
Veronica Reply
Step 1: Find the mean. To find the mean, add up all the scores, then divide them by the number of scores. ... Step 2: Find each score's deviation from the mean. ... Step 3: Square each deviation from the mean. ... Step 4: Find the sum of squares. ... Step 5: Divide the sum of squares by n – 1 or N.
kenneth
what is error
Yakuba Reply
Is mistake done to something
Vutshila
Hy
anas
hy
What is the life teble
anas
hy
Jibrin
statistics is the analyzing of data
Tajudeen Reply
what is statics?
Zelalem Reply
how do you calculate mean
Gloria Reply
diveving the sum if all values
Shaynaynay
let A1,A2 and A3 events be independent,show that (A1)^c, (A2)^c and (A3)^c are independent?
Fisaye Reply
what is statistics
Akhisani Reply
data collected all over the world
Shaynaynay
construct a less than and more than table
Imad Reply
The sample of 16 students is taken. The average age in the sample was 22 years with astandard deviation of 6 years. Construct a 95% confidence interval for the age of the population.
Aschalew Reply
Bhartdarshan' is an internet-based travel agency wherein customer can see videos of the cities they plant to visit. The number of hits daily is a normally distributed random variable with a mean of 10,000 and a standard deviation of 2,400 a. what is the probability of getting more than 12,000 hits? b. what is the probability of getting fewer than 9,000 hits?
Akshay Reply
Bhartdarshan'is an internet-based travel agency wherein customer can see videos of the cities they plan to visit. The number of hits daily is a normally distributed random variable with a mean of 10,000 and a standard deviation of 2,400. a. What is the probability of getting more than 12,000 hits
Akshay
1
Bright
Sorry i want to learn more about this question
Bright
Someone help
Bright
a= 0.20233 b=0.3384
Sufiyan
a
Shaynaynay
How do I interpret level of significance?
Mohd Reply
It depends on your business problem or in Machine Learning you could use ROC- AUC cruve to decide the threshold value
Shivam
how skewness and kurtosis are used in statistics
Owen Reply
yes what is it
Taneeya

Get Jobilize Job Search Mobile App in your pocket Now!

Get it on Google Play Download on the App Store Now


Source:  OpenStax, Introductory statistics. OpenStax CNX. May 06, 2016 Download for free at http://legacy.cnx.org/content/col11562/1.18
Google Play and the Google Play logo are trademarks of Google Inc.

Notification Switch

Would you like to follow the 'Introductory statistics' conversation and receive update notifications?

Ask