

| << Chapter < Page | Chapter >> Page > |
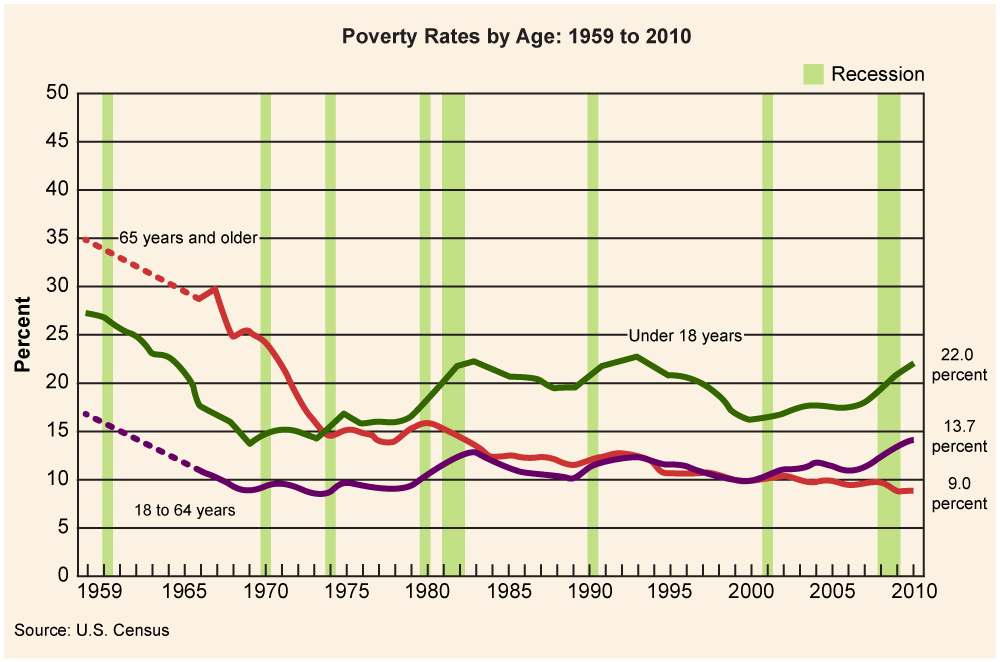
Most developed countries such as the United States protect their citizens from absolute poverty by providing different levels of social services such as unemployment insurance, welfare, food assistance, and so on. They may also provide job training and retraining so that people can reenter the job market. In the past, the elderly were particularly vulnerable to falling into poverty after they stopped working; however, pensions, retirement plans, and Social Security were designed to help prevent this. A major concern in the United States is the rising number of young people growing up in poverty. Growing up poor can cut off access to the education and services people need to move out of poverty and into stable employment. As we saw, more education was often a key to stability, and those raised in poverty are the ones least able to find well-paying work, perpetuating a cycle.
There is great debate about how much support local, state, and federal governments should give to help the unemployed and underemployed. The decisions made on these issues will have a profound effect on working in the United States.
The job market in the United States is meant to be a meritocracy that creates social stratifications based on individual achievement. Economic forces, such as outsourcing and automation, are polarizing the workforce, with most job opportunities being either low-level, low-paying manual jobs or high-level, high-paying jobs based on abstract skills. Women's role in the workforce has increased, although women have not yet achieved full equality. Immigrants play an important role in the U.S. labor market. The changing economy has forced more people into poverty even if they are working. Welfare, Social Security, and other social programs exist to protect people from the worst effects of poverty.
As polarization occurs in the U.S. job market, this will affect other social institutions. For example, if midlevel education won’t lead to employment, we could see polarization in educational levels as well. Use the sociological imagination to consider what social institutions may be impacted, and how.
Do you believe we have a true meritocracy in the United States? Why, or why not?
The role of women in the workplace is constantly changing. To learn more, check out (External Link)
The Employment Projections Program of the U.S. Bureau of Labor Statistics looks at a ten-year projection for jobs and employment. To see some trends for the next decade, check out (External Link)
Autor, David. 2010. “The Polarization of Job Opportunities in the U.S. Labor Market Implications for Employment and Earnings.” MIT Department of Economics and National Bureau of Economic Research, April. Retrieved February 15, 2012 ( (External Link) ).
Batalova, Jeanne, and Aaron Terrazas. 2010. “Frequently Requested Statistics on Immigrants and Immigration in the United States.” Migration Policy Institute. Retrieved February 6, 2012 ( (External Link) ).
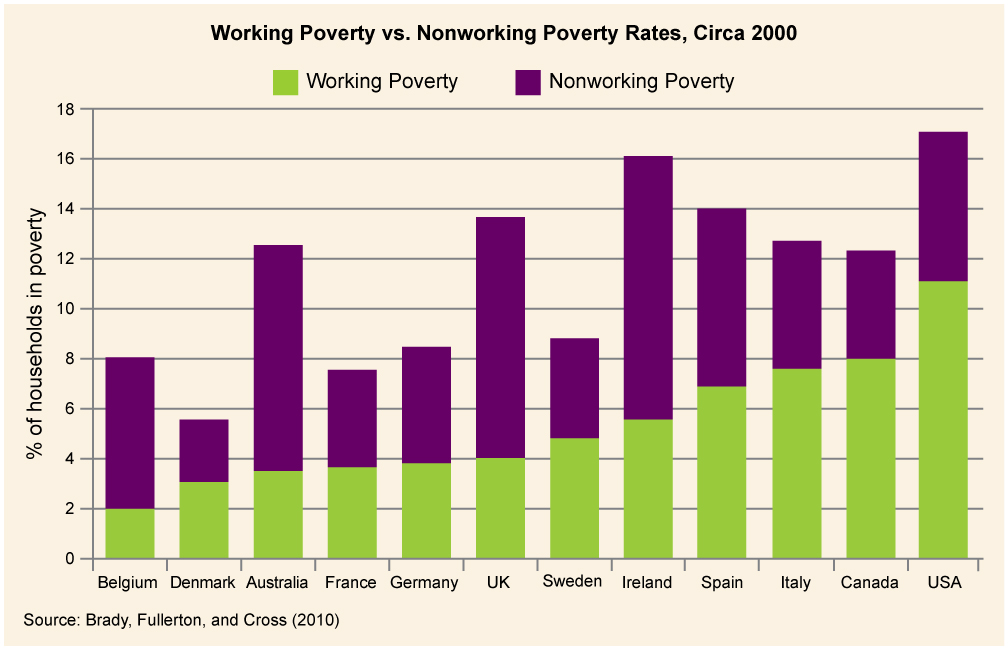
Brady, David, Andrew Fullerton, and Jennifer Moren Cross. 2010. “More Than Just Nickels and Dimes: A Cross-National Analysis of Working Poverty in Affluent Democracies.” Social Problems 57:559–585. Retrieved February 15, 2012 ( (External Link) ).
DeNavas-Walt, Carmen, and Bernadette D. Proctor. 2013. "Income and Poverty in the United States: 2013." U.S. Census Bureau. Retrieved December 15, 2014. ( (External Link) ).
Hainmueller, Jens, and Michael J. Hiscox. 2010. “Attitudes Toward Highly Skilled and Low-Skilled Immigration: Evidence from a Survey Experiment.” American Political Science Review 104:61–84.
Holland, Laurence H.M. and David M. Ewalt. 2006. “Making Real Money in Virtual Worlds,” Forbes , August 7. Retrieved January 30, 2012 ( (External Link) ).
Kochhar, Rokesh. 2010. “After the Great Recession: Foreign Born Gain Jobs; Native Born Lose Jobs.” Pew Hispanic Center, October 29. Retrieved January 29, 2012 ( (External Link) ).
Lowell, Lindsay B., Julia Gelatt, and Jeanne Batalova. 2006. “Immigrants and Labor Force Trends: the Future, Past, and Present.” Migration Policy Institute Insight No. 17. Retrieved February 6, 2012 ( (External Link) ).
U.S. Bureau of Labor Statistics. 2010. Occupational Outlook Handbook , 2006–2007 ed. Retrieved from February 15, 2012 ( www.bls.gov/oco ).
U.S. Bureau of Labor Statistics. 2010. “Overview of the 2008-2018 Projections.” Occupational Outlook Handbook , 2010–2011 ed. Retrieved February 15, 2012 ( (External Link) ).
U.S. Bureau of Labor Statistics. 2011. “A Profile of the Working Poor, 2009.” Retrieved January 25, 2012 ( www.bls.gov/cps/cpswp2009.pdf ).
U.S Bureau of Labor Statistics. 2012. "Employment Projections–2010–20." U.S. Department of Labor. Retrieved December 15, 2014. ( (External Link) ).
U.S. Bureau of Labor Statistics. 2013. "Occupational Employment Projections to 2022." Deoartment of Labor. Retrieved December 15, 2014. ( (External Link) ).
U.S. Bureau of Labor Statistics. 2013. "Table 7: Employment by Summary Education and Training Assignment, 2012 and Projected 2022." United States Department of Labor. Retrieved December 15, 2014. ( (External Link) ).
U.S. Census Bureau. 2010. “Income, Poverty, and Health Insurance Coverage in the United States.” Retrieved February 15, 2012 ( (External Link) ).
Wang, Wendy and Kim Parker. 2011. “Women See Value and Benefit of College; Men Lag Behind on Both Fronts.” Pew Social and Demographic Trends, August 17. Retrieved January 30, 2012 ( (External Link) ).
Wheaton, Sarah. 2011. “Perry Repeats Socialist Charge Against Obama Policies.” New York Times , September 15. Retrieved January 30, 2012 ( (External Link) ).
Notification Switch
Would you like to follow the 'Introduction to sociology 2e' conversation and receive update notifications?

|
|
|
|
|

|
|

|
|

|
|

|
|

|
|

|
|

|
|

|
|

|
|

|