

| << Chapter < Page | Chapter >> Page > |
Human ecology is a functionalist field of study that looks at on the relationship between people and their built and natural physical environments (Park 1915). Generally speaking, urban land use and urban population distribution occur in a predictable pattern once we understand how people relate to their living environment. For example, in the United States, we have a transportation system geared to accommodate individuals and families in the form of interstate highways built for cars. In contrast, most parts of Europe emphasize public transportation such as high-speed rail and commuter lines, as well as walking and bicycling. The challenge for a human ecologist working in U.S. urban planning is to design landscapes and waterscapes with natural beauty, while also figuring out how to provide for free-flowing transport of innumerable vehicles, not to mention parking!
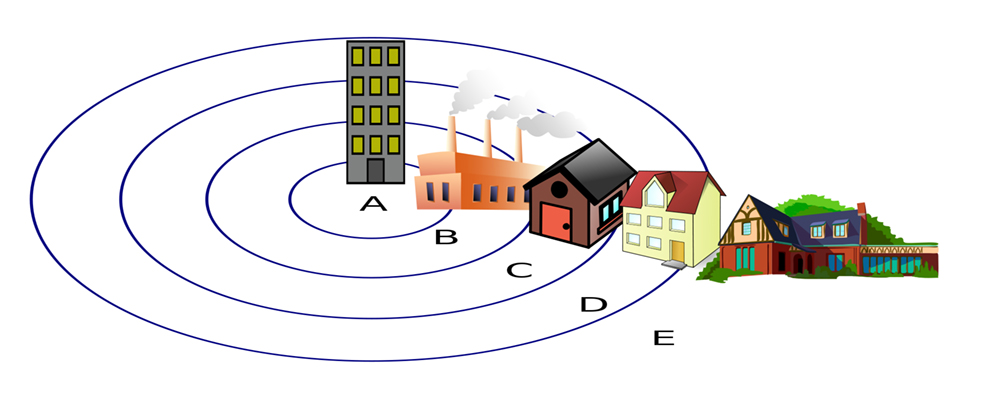
The concentric zone model (Burgess 1925) is perhaps the most famous example of human ecology. This model views a city as a series of concentric circular areas, expanding outward from the center of the city, with various “zones” invading adjacent zones (as new categories of people and businesses overrun the edges of nearby zones) and succeeding (then after invasion, the new inhabitants repurpose the areas they have invaded and push out the previous inhabitants). In this model, Zone A, in the heart of the city, is the center of the business and cultural district. Zone B, the concentric circle surrounding the city center, is composed of formerly wealthy homes split into cheap apartments for new immigrant populations; this zone also houses small manufacturers, pawn shops, and other marginal businesses. Zone C consists of the homes of the working class and established ethnic enclaves. Zone D holds wealthy homes, white-collar workers, and shopping centers. Zone E contains the estates of the upper class (in the exurbs) and the suburbs.
In contrast to the functionalist approach, theoretical models in the conflict perspective focus on the way urban areas change according to specific decisions made by political and economic leaders. These decisions generally benefit the middle and upper classes while exploiting the working and lower classes.
For example, sociologists Feagin and Parker (1990) suggested three factors by which political and economic leaders control urban growth. First, these leaders work alongside each other to influence urban growth and decline, determining where money flows and how land use is regulated. Second, exchange value and use value of land are balanced to favor the middle and upper classes so that, for example, public land in poor neighborhoods may be rezoned for use as industrial land. Finally, urban development is dependent on both structure (groups such as local government) and agency (individuals including businessmen and activists), and these groups engage in a push-pull dynamic that determines where and how land is actually used. For example, Not In My Back Yard (NIMBY) movements are more likely to emerge in middle and upper-class neighborhoods as engaged citizens protest poor environmental practices they fear will affect them, so these groups have more control over the use of local land.
Cities provide numerous opportunities for their residents and offer significant benefits including access to goods to numerous job opportunities. At the same time, high population areas can lead to tensions between demographic groups, as well as environmental strain. While the population of urban dwellers is continuing to rise, sources of social strain are rising along with it. The ultimate challenge for today’s urbanites is finding an equitable way to share the city’s resources while reducing the pollution and energy use that negatively impacts the environment.
What are the differences between the suburbs and the exurbs, and who is most likely to live in each?
How will the growth in urban populations affect the world over the next ten years?
Considering the concentric zone model, what type of zone were you raised in? Is this the same or different as that of earlier generations in your family? What type of zone do you reside in now? Do you find that people from one zone stereotype those from another? If so, how?
Interested in learning more about the latest research in the field of human ecology? Visit the Society for Human Ecology web site to discover what’s emerging in this field: (External Link)
Getting from place to place in urban areas might be more complicated than you think. Read the latest on pedestrian-traffic concerns at the Urban Blog web site: (External Link)
BBC. 2005. “Timeline: French Riots—A Chronology of Key Events.” November 14. Retrieved December 9, 2011 ( (External Link) ).
Burgess, Ernest. 1925. “The Growth of the City.” Pp. 47–62 in The City , edited by R. Park and E. Burgess. Chicago: University of Chicago Press.
Chandler, Tertius and Gerald Fox. 1974. 3000 Years of Urban History . New York: Academic Press.
Dougherty, Connor. 2008. “The End of White Flight.” Wall Street Journal , July 19. Retrieved December 12, 2011 ( (External Link) ).
Feagin, Joe, and Robert Parker. 1990. Building American Cities: The Urban Real Estate Game . 2nd ed. Englewood Cliffs, NJ: Prentice Hall.
France24. 2010. “Sarkozy Promises War without Mercy for Paris Suburbs.” France 24 , April 10. Retrieved December 9, 2011 ( (External Link) ).
LeBlanc, Adrien Nicole. 2003. Random Family: Love, Drugs, Trouble and Coming of Age in the Bronx . New York: Scribner.
Park, Robert. 1934 [1915]. “The City: Suggestions for Investigations of Human Behavior in the City.” American Journal of Sociology 20:577–612.
Park, Robert. 1936. “Human Ecology.” American Journal of Sociology 42:1–15.
Old Bailey Proceedings Online. 2011. “Population History of London.” Retrieved December 11, 2011 ( (External Link) ).
Sciolino, Elaine, and Ariane Bernand. 2006. “Anger Festering in French Areas Scarred in Riots.” New York Times , October 21. Retrieved December 11, 2011 ( (External Link)&sq=paris+suburb&st=nyt ).
Sjoberg, Gideon. 1965. The Preindustrial City: Past and Present . New York: Free Press.
Talbot, Margaret. 2003. “Review: Random Family. Love, Drugs, Trouble and Coming of Age in the Bronx.” New York Times , February 9. Retrieved December 12, 2011 ( (External Link)&src=pm ).
United Nations, Department of Economic and Social Affairs, Population Division. 2014. “World Urbanization Prospects: The 2014 Revision, Highlights” (ST/ESA/SER.A/352). Retrieved November 3, 2014 (http://esa.un.org/unpd/wup/Highlights/WUP2014-Highlights.pdf).
United States Census Bureau. 2014, "2010 Census Urban and Rural Classification and Urban Area Criteria." Retrieved December 16, 2014 (http://www.census.gov/geo/reference/ua/urban-rural-2010.html).
Notification Switch
Would you like to follow the 'Introduction to sociology 2e' conversation and receive update notifications?

|
|
|
|
|

|
|

|
|

|
|

|
|

|
|

|
|

|
|

|
|

|
|
|
|