

| << Chapter < Page | Chapter >> Page > |
There is an element of social construction, both local and global, in the way individuals and nations define who is elderly; that is, the shared meaning of the concept of elderly is created through interactions among people in society. This is exemplified by the truism that you are only as old as you feel.
Demographically, the U.S. population over sixty-five years old increased from 3 million in 1900 to 33 million in 1994 (Hobbs 1994) and to 36.8 million in 2010 (U.S. Census Bureau 2011c). This is a greater than tenfold increase in the elderly population, compared to a mere tripling of both the total population and of the population under sixty-five years old (Hobbs 1994). This increase has been called “the graying of America,” a term that describes the phenomenon of a larger and larger percentage of the population getting older and older. There are several reasons why the United States is graying so rapidly. One of these is life expectancy : the average number of years a person born today may expect to live. When we review Census Bureau statistics grouping the elderly by age, it is clear that in the United States, at least, we are living longer. In 2010, there were about 80,000 centenarians in the United States alone. They make up one of the fastest-growing segments of the population (Boston University School of Medicine 2014).
People over ninety years of age now account for 4.7 percent of the older population, defined as age sixty-five or above; this percentage is expected to reach 10 percent by the year 2050 (U.S. Census Bureau 2011). As of 2013, the U.S. Census Bureau reports that 14.1 percent of the total U.S. population is sixty-five years old or older.
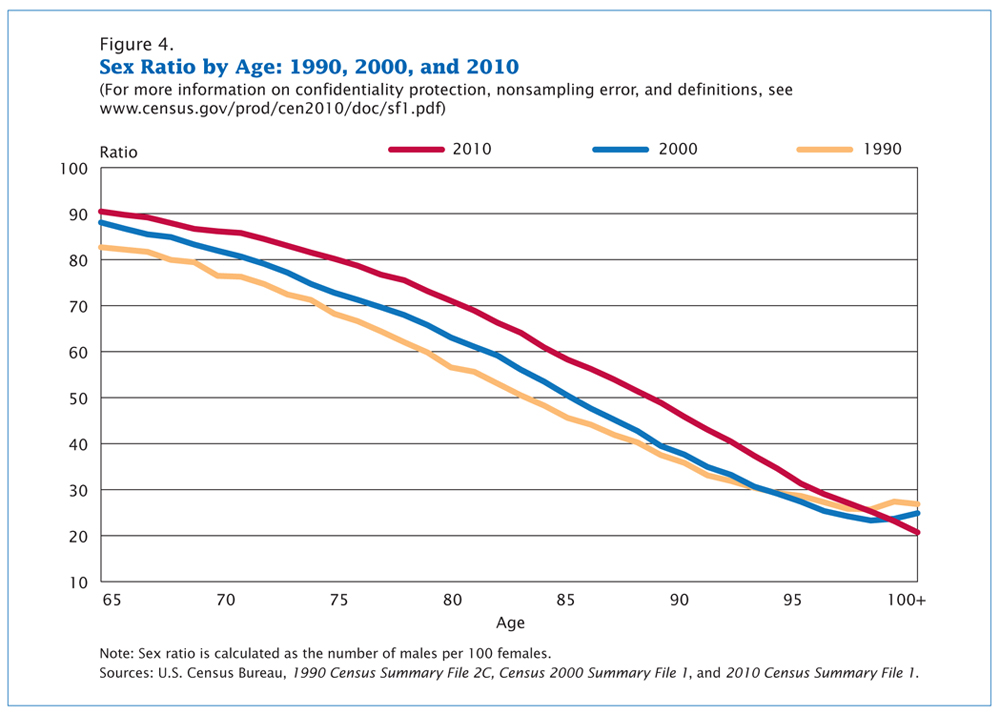
It is interesting to note that not all people in the United States age equally. Most glaring is the difference between men and women; as [link] shows, women have longer life expectancies than men. In 2010, there were ninety sixty-five-year-old men per one hundred sixty-five-year-old women. However, there were only eighty seventy-five-year-old men per one hundred seventy-five-year-old women, and only sixty eighty-five-year-old men per one hundred eighty-five-year-old women. Nevertheless, as the graph shows, the sex ratio actually increased over time, indicating that men are closing the gap between their life spans and those of women (U.S. Census Bureau 2010).
Of particular interest to gerontologists today is the population of baby boomers , the cohort born between 1946 and 1964 and now reaching their 60s. Coming of age in the 1960s and early 1970s, the baby boom generation was the first group of children and teenagers with their own spending power and therefore their own marketing power (Macunovich 2000). As this group has aged, it has redefined what it means to be young, middle-aged, and now old. People in the boomer generation do not want to grow old the way their grandparents did; the result is a wide range of products designed to ward off the effects—or the signs—of aging. Previous generations of people over sixty-five were “old.” Baby boomers are in “later life” or “the third age” (Gilleard and Higgs 2007).
Notification Switch
Would you like to follow the 'Introduction to sociology 2e' conversation and receive update notifications?

|
|
|
|
|

|
|

|
|

|
|

|
|

|
|

|
|

|
|

|
|

|
|

|