<< Chapter < Page Chapter >> Page >
By the end of this section, you will be able to:
  • Explain how people with psychological disorders have been treated throughout the ages
  • Discuss deinstitutionalization
  • Discuss the ways in which mental health services are delivered today
  • Distinguish between voluntary and involuntary treatment

Before we explore the various approaches to therapy used today, let’s begin our study of therapy by looking at how many people experience mental illness and how many receive treatment. According to the U.S. Department of Health and Human Services (2013), 19% of U.S. adults experienced mental illness in 2012. For teens (ages 13–18), the rate is similar to that of adults, and for children ages 8–15, current estimates suggest that 13% experience mental illness in a given year (National Institute of Mental Health [NIMH], n.d.-a)

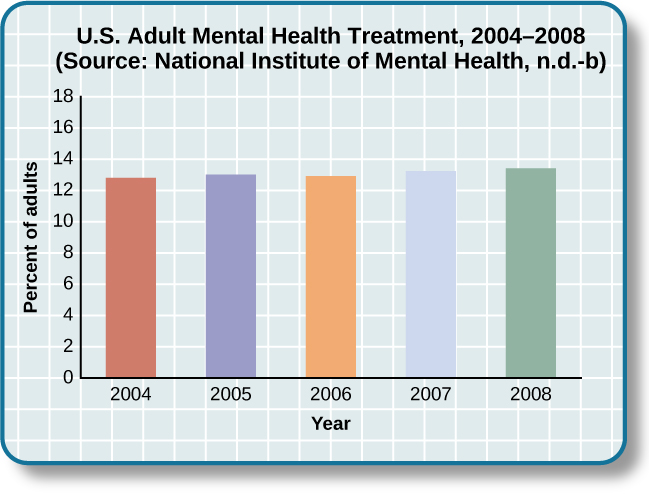
With many different treatment options available, approximately how many people receive mental health treatment per year? According to the Substance Abuse and Mental Health Services Administration (SAMHSA), in 2008, 13.4% of adults received treatment for a mental health issue (NIMH, n.d.-b). These percentages, shown in [link] , reflect the number of adults who received care in inpatient and outpatient settings and/or used prescription medication for psychological disorders.

A bar graph is titled “U.S. Adult Mental Health Treatment, 2004–2008.” Below this title the source is given: “National Institute of Mental Health, n.d.-b” The x axis is labeled “Year,” and the y axis is labeled “Percent of adults.” In the years 2004, 2005 and 2006, the percentage of adults who received treatment hovered at 13 percent or just below. For the years 2007 and 2008, the percentage rose slightly closer to 14 percent.
The percentage of adults who received mental health treatment in 2004–2008 is shown. Adults seeking treatment increased slightly from 2004 to 2008.

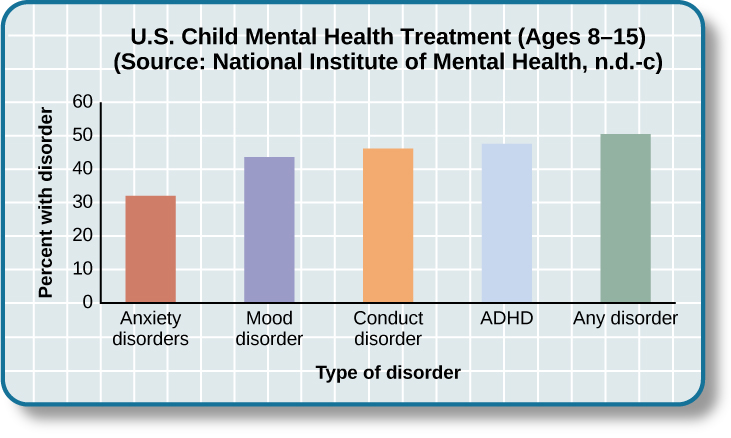
Children and adolescents also receive mental health services. The Centers for Disease Control and Prevention's National Health and Nutrition Examination Survey (NHANES) found that approximately half (50.6%) of children with mental disorders had received treatment for their disorder within the past year (NIMH, n.d.-c). However, there were some differences between treatment rates by category of disorder ( [link] ). For example, children with anxiety disorders were least likely to have received treatment in the past year, while children with ADHD or a conduct disorder were more likely to receive treatment. Can you think of some possible reasons for these differences in receiving treatment?

A bar graph is titled “U.S. Child Mental Health Treatment (Ages 8–15).” Below this title the source is given: “National Institute of Mental Health, n.d.-c” The x axis is labeled “Type of disorder,” and the y axis is labeled “Percent with disorder.” For children diagnosed with “Anxiety disorders,” around 32 percent receive treatment. For “Mood disorder,” around 42 percent receive treatment. For “Conduct disorder,” around 46 percent receive treatment. For “ADHD,” around 48 percent receive treatment. For “Any disorder,” around 50 percent receive treatment.
About one-third to one-half of U.S. adolescents (ages 8–15) with mental disorders receive treatment, with behavior-related disorders more likely to be treated.

Considering the many forms of treatment for mental health disorders available today, how did these forms of treatment emerge? Let’s take a look at the history of mental health treatment from the past (with some questionable approaches in light of modern understanding of mental illness) to where we are today.

Treatment in the past

For much of history, the mentally ill have been treated very poorly. It was believed that mental illness was caused by demonic possession, witchcraft, or an angry god (Szasz, 1960). For example, in medieval times, abnormal behaviors were viewed as a sign that a person was possessed by demons. If someone was considered to be possessed, there were several forms of treatment to release spirits from the individual. The most common treatment was exorcism, often conducted by priests or other religious figures: Incantations and prayers were said over the person’s body, and she may have been given some medicinal drinks. Another form of treatment for extreme cases of mental illness was trephining: A small hole was made in the afflicted individual’s skull to release spirits from the body. Most people treated in this manner died. In addition to exorcism and trephining, other practices involved execution or imprisonment of people with psychological disorders. Still others were left to be homeless beggars. Generally speaking, most people who exhibited strange behaviors were greatly misunderstood and treated cruelly. The prevailing theory of psychopathology in earlier history was the idea that mental illness was the result of demonic possession by either an evil spirit or an evil god because early beliefs incorrectly attributed all unexplainable phenomena to deities deemed either good or evil.

Questions & Answers

differentiate between demand and supply giving examples
Lambiv Reply
differentiated between demand and supply using examples
Lambiv
what is labour ?
Lambiv
how will I do?
Venny Reply
how is the graph works?I don't fully understand
Rezat Reply
information
Eliyee
devaluation
Eliyee
t
WARKISA
hi guys good evening to all
Lambiv
multiple choice question
Aster Reply
appreciation
Eliyee
explain perfect market
Lindiwe Reply
In economics, a perfect market refers to a theoretical construct where all participants have perfect information, goods are homogenous, there are no barriers to entry or exit, and prices are determined solely by supply and demand. It's an idealized model used for analysis,
Ezea
What is ceteris paribus?
Shukri Reply
other things being equal
AI-Robot
When MP₁ becomes negative, TP start to decline. Extuples Suppose that the short-run production function of certain cut-flower firm is given by: Q=4KL-0.6K2 - 0.112 • Where is quantity of cut flower produced, I is labour input and K is fixed capital input (K-5). Determine the average product of lab
Kelo
Extuples Suppose that the short-run production function of certain cut-flower firm is given by: Q=4KL-0.6K2 - 0.112 • Where is quantity of cut flower produced, I is labour input and K is fixed capital input (K-5). Determine the average product of labour (APL) and marginal product of labour (MPL)
Kelo
yes,thank you
Shukri
Can I ask you other question?
Shukri
what is monopoly mean?
Habtamu Reply
What is different between quantity demand and demand?
Shukri Reply
Quantity demanded refers to the specific amount of a good or service that consumers are willing and able to purchase at a give price and within a specific time period. Demand, on the other hand, is a broader concept that encompasses the entire relationship between price and quantity demanded
Ezea
ok
Shukri
how do you save a country economic situation when it's falling apart
Lilia Reply
what is the difference between economic growth and development
Fiker Reply
Economic growth as an increase in the production and consumption of goods and services within an economy.but Economic development as a broader concept that encompasses not only economic growth but also social & human well being.
Shukri
production function means
Jabir
What do you think is more important to focus on when considering inequality ?
Abdisa Reply
any question about economics?
Awais Reply
sir...I just want to ask one question... Define the term contract curve? if you are free please help me to find this answer 🙏
Asui
it is a curve that we get after connecting the pareto optimal combinations of two consumers after their mutually beneficial trade offs
Awais
thank you so much 👍 sir
Asui
In economics, the contract curve refers to the set of points in an Edgeworth box diagram where both parties involved in a trade cannot be made better off without making one of them worse off. It represents the Pareto efficient allocations of goods between two individuals or entities, where neither p
Cornelius
In economics, the contract curve refers to the set of points in an Edgeworth box diagram where both parties involved in a trade cannot be made better off without making one of them worse off. It represents the Pareto efficient allocations of goods between two individuals or entities,
Cornelius
Suppose a consumer consuming two commodities X and Y has The following utility function u=X0.4 Y0.6. If the price of the X and Y are 2 and 3 respectively and income Constraint is birr 50. A,Calculate quantities of x and y which maximize utility. B,Calculate value of Lagrange multiplier. C,Calculate quantities of X and Y consumed with a given price. D,alculate optimum level of output .
Feyisa Reply
Answer
Feyisa
c
Jabir
the market for lemon has 10 potential consumers, each having an individual demand curve p=101-10Qi, where p is price in dollar's per cup and Qi is the number of cups demanded per week by the i th consumer.Find the market demand curve using algebra. Draw an individual demand curve and the market dema
Gsbwnw Reply
suppose the production function is given by ( L, K)=L¼K¾.assuming capital is fixed find APL and MPL. consider the following short run production function:Q=6L²-0.4L³ a) find the value of L that maximizes output b)find the value of L that maximizes marginal product
Abdureman
types of unemployment
Yomi Reply
What is the difference between perfect competition and monopolistic competition?
Mohammed
Got questions? Join the online conversation and get instant answers!
Jobilize.com Reply

Get Jobilize Job Search Mobile App in your pocket Now!

Get it on Google Play Download on the App Store Now


Source:  OpenStax, Psychology. OpenStax CNX. Feb 03, 2015 Download for free at https://legacy.cnx.org/content/col11629/1.5
Google Play and the Google Play logo are trademarks of Google Inc.

Notification Switch

Would you like to follow the 'Psychology' conversation and receive update notifications?

Ask