

| << Chapter < Page | Chapter >> Page > |
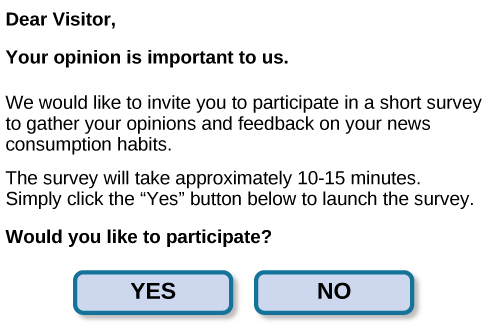
Often, psychologists develop surveys as a means of gathering data. Surveys are lists of questions to be answered by research participants, and can be delivered as paper-and-pencil questionnaires, administered electronically, or conducted verbally ( [link] ). Generally, the survey itself can be completed in a short time, and the ease of administering a survey makes it easy to collect data from a large number of people.
Surveys allow researchers to gather data from larger samples than may be afforded by other research methods . A sample is a subset of individuals selected from a population , which is the overall group of individuals that the researchers are interested in. Researchers study the sample and seek to generalize their findings to the population.
There is both strength and weakness of the survey in comparison to case studies. By using surveys, we can collect information from a larger sample of people. A larger sample is better able to reflect the actual diversity of the population, thus allowing better generalizability. Therefore, if our sample is sufficiently large and diverse, we can assume that the data we collect from the survey can be generalized to the larger population with more certainty than the information collected through a case study. However, given the greater number of people involved, we are not able to collect the same depth of information on each person that would be collected in a case study.
Another potential weakness of surveys is something we touched on earlier in this chapter: People don't always give accurate responses. They may lie, misremember, or answer questions in a way that they think makes them look good. For example, people may report drinking less alcohol than is actually the case.
Any number of research questions can be answered through the use of surveys. One real-world example is the research conducted by Jenkins, Ruppel, Kizer, Yehl, and Griffin (2012) about the backlash against the US Arab-American community following the terrorist attacks of September 11, 2001. Jenkins and colleagues wanted to determine to what extent these negative attitudes toward Arab-Americans still existed nearly a decade after the attacks occurred. In one study, 140 research participants filled out a survey with 10 questions, including questions asking directly about the participant’s overt prejudicial attitudes toward people of various ethnicities. The survey also asked indirect questions about how likely the participant would be to interact with a person of a given ethnicity in a variety of settings (such as, “How likely do you think it is that you would introduce yourself to a person of Arab-American descent?”). The results of the research suggested that participants were unwilling to report prejudicial attitudes toward any ethnic group. However, there were significant differences between their pattern of responses to questions about social interaction with Arab-Americans compared to other ethnic groups: they indicated less willingness for social interaction with Arab-Americans compared to the other ethnic groups. This suggested that the participants harbored subtle forms of prejudice against Arab-Americans, despite their assertions that this was not the case (Jenkins et al., 2012).
Notification Switch
Would you like to follow the 'Psychology' conversation and receive update notifications?

|
|
|
|
|

|
|

|
|

|
|

|
|

|
|

|
|

|
|

|
|

|
|

|