<< Chapter < Page Chapter >> Page >

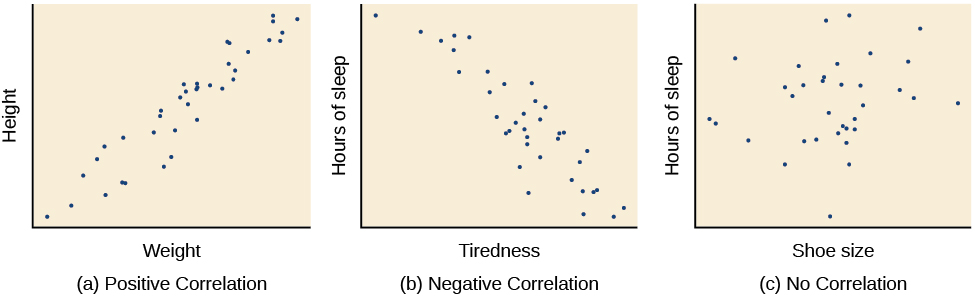
The example of ice cream and crime rates is a positive correlation because both variables increase when temperatures are warmer. Other examples of positive correlations are the relationship between an individual’s height and weight or the relationship between a person’s age and number of wrinkles. One might expect a negative correlation to exist between someone’s tiredness during the day and the number of hours they slept the previous night: the amount of sleep decreases as the feelings of tiredness increase. In a real-world example of negative correlation, student researchers at the University of Minnesota found a weak negative correlation ( r = -0.29) between the average number of days per week that students got fewer than 5 hours of sleep and their GPA (Lowry, Dean,&Manders, 2010). Keep in mind that a negative correlation is not the same as no correlation. For example, we would probably find no correlation between hours of sleep and shoe size.

As mentioned earlier, correlations have predictive value. Imagine that you are on the admissions committee of a major university. You are faced with a huge number of applications, but you are able to accommodate only a small percentage of the applicant pool. How might you decide who should be admitted? You might try to correlate your current students’ college GPA with their scores on standardized tests like the SAT or ACT. By observing which correlations were strongest for your current students, you could use this information to predict relative success of those students who have applied for admission into the university.

Three scatterplots are shown. Scatterplot (a) is labeled “positive correlation” and shows scattered dots forming a rough line from the bottom left to the top right; the x-axis is labeled “weight” and the y-axis is labeled “height.” Scatterplot (b) is labeled “negative correlation” and shows scattered dots forming a rough line from the top left to the bottom right; the x-axis is labeled “tiredness” and the y-axis is labeled “hours of sleep.” Scatterplot (c) is labeled “no correlation” and shows scattered dots having no pattern; the x-axis is labeled “shoe size” and the y-axis is labeled “hours of sleep.”
Scatterplots are a graphical view of the strength and direction of correlations. The stronger the correlation, the closer the data points are to a straight line. In these examples, we see that there is (a) a positive correlation between weight and height, (b) a negative correlation between tiredness and hours of sleep, and (c) no correlation between shoe size and hours of sleep.

Correlation does not indicate causation

Correlational research is useful because it allows us to discover the strength and direction of relationships that exist between two variables. However, correlation is limited because establishing the existence of a relationship tells us little about cause and effect . While variables are sometimes correlated because one does cause the other, it could also be that some other factor, a confounding variable    , is actually causing the systematic movement in our variables of interest. In the ice cream/crime rate example mentioned earlier, temperature is a confounding variable that could account for the relationship between the two variables.

Even when we cannot point to clear confounding variables, we should not assume that a correlation between two variables implies that one variable causes changes in another. This can be frustrating when a cause-and-effect relationship seems clear and intuitive. Think back to our discussion of the research done by the American Cancer Society and how their research projects were some of the first demonstrations of the link between smoking and cancer. It seems reasonable to assume that smoking causes cancer, but if we were limited to correlational research , we would be overstepping our bounds by making this assumption.

Questions & Answers

how do you get the 2/50
Abba Reply
number of sport play by 50 student construct discrete data
Aminu Reply
width of the frangebany leaves on how to write a introduction
Theresa Reply
Solve the mean of variance
Veronica Reply
Step 1: Find the mean. To find the mean, add up all the scores, then divide them by the number of scores. ... Step 2: Find each score's deviation from the mean. ... Step 3: Square each deviation from the mean. ... Step 4: Find the sum of squares. ... Step 5: Divide the sum of squares by n – 1 or N.
kenneth
what is error
Yakuba Reply
Is mistake done to something
Vutshila
Hy
anas
hy
What is the life teble
anas
hy
Jibrin
statistics is the analyzing of data
Tajudeen Reply
what is statics?
Zelalem Reply
how do you calculate mean
Gloria Reply
diveving the sum if all values
Shaynaynay
let A1,A2 and A3 events be independent,show that (A1)^c, (A2)^c and (A3)^c are independent?
Fisaye Reply
what is statistics
Akhisani Reply
data collected all over the world
Shaynaynay
construct a less than and more than table
Imad Reply
The sample of 16 students is taken. The average age in the sample was 22 years with astandard deviation of 6 years. Construct a 95% confidence interval for the age of the population.
Aschalew Reply
Bhartdarshan' is an internet-based travel agency wherein customer can see videos of the cities they plant to visit. The number of hits daily is a normally distributed random variable with a mean of 10,000 and a standard deviation of 2,400 a. what is the probability of getting more than 12,000 hits? b. what is the probability of getting fewer than 9,000 hits?
Akshay Reply
Bhartdarshan'is an internet-based travel agency wherein customer can see videos of the cities they plan to visit. The number of hits daily is a normally distributed random variable with a mean of 10,000 and a standard deviation of 2,400. a. What is the probability of getting more than 12,000 hits
Akshay
1
Bright
Sorry i want to learn more about this question
Bright
Someone help
Bright
a= 0.20233 b=0.3384
Sufiyan
a
Shaynaynay
How do I interpret level of significance?
Mohd Reply
It depends on your business problem or in Machine Learning you could use ROC- AUC cruve to decide the threshold value
Shivam
how skewness and kurtosis are used in statistics
Owen Reply
yes what is it
Taneeya
Got questions? Join the online conversation and get instant answers!
Jobilize.com Reply

Get Jobilize Job Search Mobile App in your pocket Now!

Get it on Google Play Download on the App Store Now


Source:  OpenStax, Psychology. OpenStax CNX. Feb 03, 2015 Download for free at https://legacy.cnx.org/content/col11629/1.5
Google Play and the Google Play logo are trademarks of Google Inc.

Notification Switch

Would you like to follow the 'Psychology' conversation and receive update notifications?

Ask