<< Chapter < Page Chapter >> Page >
By the end of this section, you will be able to:
  • Explain why classification systems are necessary in the study of psychopathology
  • Describe the basic features of the Diagnostic and Statistical Manual of Mental Disorders, Fifth Edition (DSM-5)
  • Discuss changes in the DSM over time, including criticisms of the current edition
  • Identify which disorders are generally the most common

A first step in the study of psychological disorders is carefully and systematically discerning significant signs and symptoms. How do mental health professionals ascertain whether or not a person’s inner states and behaviors truly represent a psychological disorder? Arriving at a proper diagnosis    —that is, appropriately identifying and labeling a set of defined symptoms—is absolutely crucial. This process enables professionals to use a common language with others in the field and aids in communication about the disorder with the patient, colleagues and the public. A proper diagnosis is an essential element to guide proper and successful treatment. For these reasons, classification systems that organize psychological disorders systematically are necessary.

THE DIAGNOSTIC AND STATISTICAL MANUAL OF MENTAL DISORDERS (dsm)

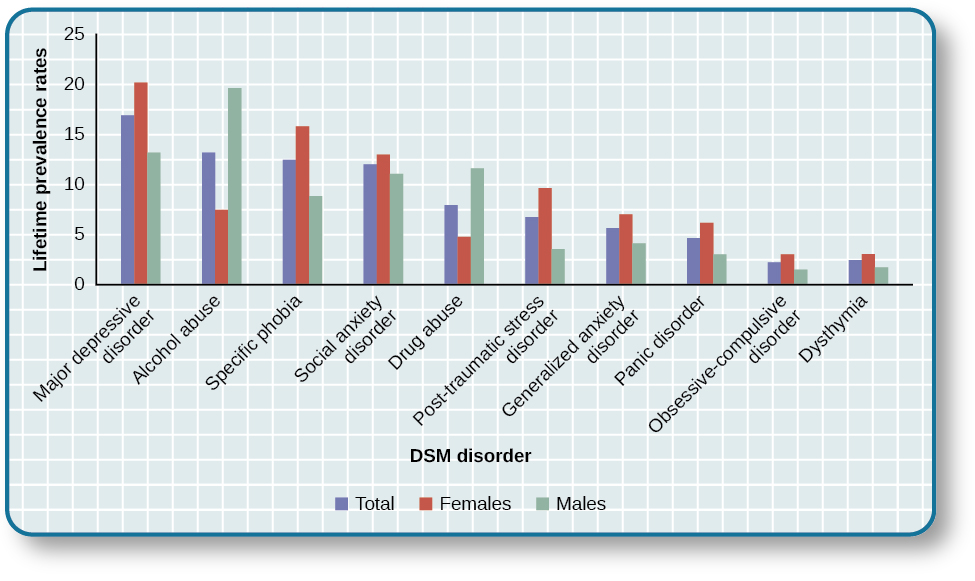
Although a number of classification systems have been developed over time, the one that is used by most mental health professionals in the United States is the Diagnostic and Statistical Manual of Mental Disorders (DSM-5) , published by the American Psychiatric Association (2013). (Note that the American Psychiatric Association differs from the American Psychological Association; both are abbreviated APA.) The first edition of the DSM, published in 1952, classified psychological disorders according to a format developed by the U.S. Army during World War II (Clegg, 2012). In the years since, the DSM has undergone numerous revisions and editions. The most recent edition, published in 2013, is the DSM-5 (APA, 2013). The DSM-5 includes many categories of disorders (e.g., anxiety disorders, depressive disorders, and dissociative disorders). Each disorder is described in detail, including an overview of the disorder (diagnostic features), specific symptoms required for diagnosis (diagnostic criteria), prevalence information (what percent of the population is thought to be afflicted with the disorder), and risk factors associated with the disorder. [link] shows lifetime prevalence rates—the percentage of people in a population who develop a disorder in their lifetime—of various psychological disorders among U.S. adults. These data were based on a national sample of 9,282 U.S. residents (National Comorbidity Survey, 2007).

A bar graph has an x-axis labeled “DSM disorder” and a y-axis labeled “Lifetime prevalence rates.” For each disorder, a prevalence rate is given for total population, females, and males. The approximate data shown is: “major depressive disorder” 17% total, 20% females, 13% males; “alcohol abuse” 13% total, 7% females, 20% males; “specific phobia” 13% total, 16% females, 8% males; “social anxiety disorder” 12% total, 13% females, 11% males; “drug abuse” 8% total, 5% females, 12% males; “posttraumatic stress disorder” 7% total, 10% females, 3% males; “generalized anxiety disorder” 6% total, 7% females, 4% males; “panic disorder” 5% total, 6% females, 3% males; “obsessive-compulsive disorder” 3% total, 3% females, 2% males; “dysthymia” 3% total, 3% females, 2% males.
The graph shows the breakdown of psychological disorders, comparing the percentage prevalence among adult males and adult females in the United States. Because the data is from 2007, the categories shown here are from the DSM-IV, which has been supplanted by the DSM-5. Most categories remain the same; however, alcohol abuse now falls under a broader Alcohol Use Disorder category.

Questions & Answers

Ayele, K., 2003. Introductory Economics, 3rd ed., Addis Ababa.
Widad Reply
can you send the book attached ?
Ariel
?
Ariel
What is economics
Widad Reply
the study of how humans make choices under conditions of scarcity
AI-Robot
U(x,y) = (x×y)1/2 find mu of x for y
Desalegn Reply
U(x,y) = (x×y)1/2 find mu of x for y
Desalegn
what is ecnomics
Jan Reply
this is the study of how the society manages it's scarce resources
Belonwu
what is macroeconomic
John Reply
macroeconomic is the branch of economics which studies actions, scale, activities and behaviour of the aggregate economy as a whole.
husaini
etc
husaini
difference between firm and industry
husaini Reply
what's the difference between a firm and an industry
Abdul
firm is the unit which transform inputs to output where as industry contain combination of firms with similar production 😅😅
Abdulraufu
Suppose the demand function that a firm faces shifted from Qd  120 3P to Qd  90  3P and the supply function has shifted from QS  20  2P to QS 10  2P . a) Find the effect of this change on price and quantity. b) Which of the changes in demand and supply is higher?
Toofiq Reply
explain standard reason why economic is a science
innocent Reply
factors influencing supply
Petrus Reply
what is economic.
Milan Reply
scares means__________________ends resources. unlimited
Jan
economics is a science that studies human behaviour as a relationship b/w ends and scares means which have alternative uses
Jan
calculate the profit maximizing for demand and supply
Zarshad Reply
Why qualify 28 supplies
Milan
what are explicit costs
Nomsa Reply
out-of-pocket costs for a firm, for example, payments for wages and salaries, rent, or materials
AI-Robot
concepts of supply in microeconomics
David Reply
economic overview notes
Amahle Reply
identify a demand and a supply curve
Salome Reply
i don't know
Parul
there's a difference
Aryan
Demand curve shows that how supply and others conditions affect on demand of a particular thing and what percent demand increase whith increase of supply of goods
Israr
Hi Sir please how do u calculate Cross elastic demand and income elastic demand?
Abari
Got questions? Join the online conversation and get instant answers!
Jobilize.com Reply

Get Jobilize Job Search Mobile App in your pocket Now!

Get it on Google Play Download on the App Store Now


Source:  OpenStax, Psychology. OpenStax CNX. Feb 03, 2015 Download for free at https://legacy.cnx.org/content/col11629/1.5
Google Play and the Google Play logo are trademarks of Google Inc.

Notification Switch

Would you like to follow the 'Psychology' conversation and receive update notifications?

Ask