Now that we have analyzed the equations for rational functions and how they relate to a graph of the function, we can use information given by a graph to write the function. A rational function written in factored form will have an
x -intercept where each factor of the numerator is equal to zero. (An exception occurs in the case of a removable discontinuity.) As a result, we can form a numerator of a function whose graph will pass through a set of
x -intercepts by introducing a corresponding set of factors. Likewise, because the function will have a vertical asymptote where each factor of the denominator is equal to zero, we can form a denominator that will produce the vertical asymptotes by introducing a corresponding set of factors.
Writing rational functions from intercepts and asymptotes
If a
rational function has
x -intercepts at
vertical asymptotes at
and no
then the function can be written in the form:
where the powers
or
on each factor can be determined by the behavior of the graph at the corresponding intercept or asymptote, and the stretch factor
can be determined given a value of the function other than the
x -intercept or by the horizontal asymptote if it is nonzero.
Given a graph of a rational function, write the function.
Determine the factors of the numerator. Examine the behavior of the graph at the
x -intercepts to determine the zeroes and their multiplicities. (This is easy to do when finding the “simplest” function with small multiplicities—such as 1 or 3—but may be difficult for larger multiplicities—such as 5 or 7, for example.)
Determine the factors of the denominator. Examine the behavior on both sides of each vertical asymptote to determine the factors and their powers.
Use any clear point on the graph to find the stretch factor.
Writing a rational function from intercepts and asymptotes
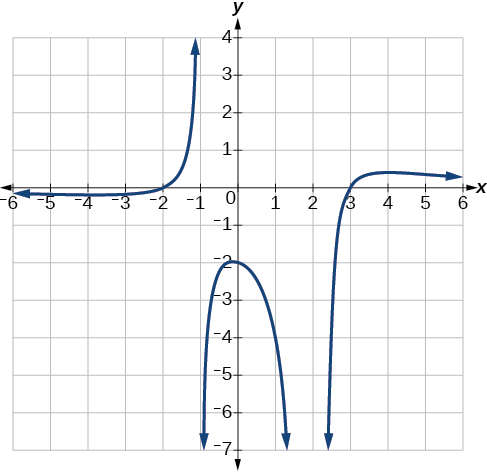
Write an equation for the rational function shown in
[link] .
The graph appears to have
x -intercepts at
and
At both, the graph passes through the intercept, suggesting linear factors. The graph has two vertical asymptotes. The one at
seems to exhibit the basic behavior similar to
with the graph heading toward positive infinity on one side and heading toward negative infinity on the other. The asymptote at
is exhibiting a behavior similar to
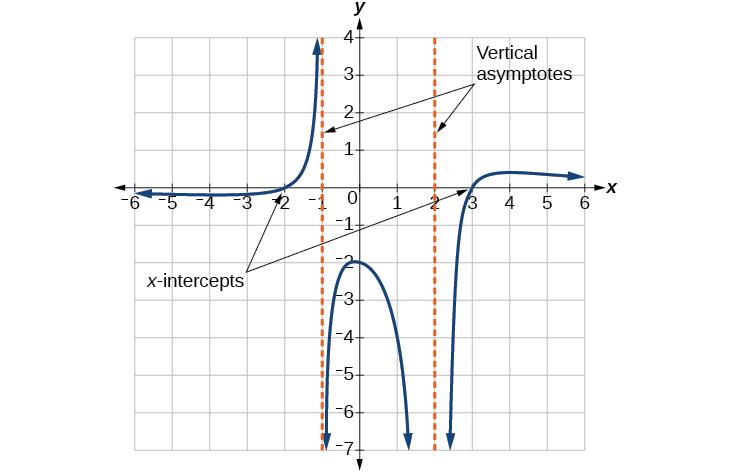
with the graph heading toward negative infinity on both sides of the asymptote. See
[link] .
We can use this information to write a function of the form
To find the stretch factor, we can use another clear point on the graph, such as the
y -intercept
Step 1: Find the mean. To find the mean, add up all the scores, then divide them by the number of scores. ...
Step 2: Find each score's deviation from the mean. ...
Step 3: Square each deviation from the mean. ...
Step 4: Find the sum of squares. ...
Step 5: Divide the sum of squares by n – 1 or N.
The sample of 16 students is taken. The average age in the sample was 22 years with astandard deviation of 6 years. Construct a 95% confidence interval for the age of the population.
Bhartdarshan' is an internet-based travel agency wherein customer can see videos of the cities they plant to visit. The number of hits daily is a normally distributed random variable with a mean of 10,000 and a standard deviation of 2,400
a. what is the probability of getting more than 12,000 hits?
b. what is the probability of getting fewer than 9,000 hits?
Bhartdarshan'is an internet-based travel agency wherein customer can see videos of the cities they plan to visit. The number of hits daily is a normally distributed random variable with a mean of 10,000 and a standard deviation of 2,400.
a. What is the probability of getting more than 12,000 hits