Now that we have learned to graph nonlinear inequalities, we can learn how to graph systems of nonlinear inequalities. A
system of nonlinear inequalities is a system of two or more inequalities in two or more variables containing at least one inequality that is not linear. Graphing a system of nonlinear inequalities is similar to graphing a system of linear inequalities. The difference is that our graph may result in more shaded regions that represent a solution than we find in a system of linear inequalities. The solution to a nonlinear system of inequalities is the region of the graph where the shaded regions of the graph of each inequality overlap, or where the regions intersect, called the
feasible region .
Given a system of nonlinear inequalities, sketch a graph.
Find the intersection points by solving the corresponding system of nonlinear equations.
Graph the nonlinear equations.
Find the shaded regions of each inequality.
Identify the feasible region as the intersection of the shaded regions of each inequality or the set of points common to each inequality.
Graphing a system of inequalities
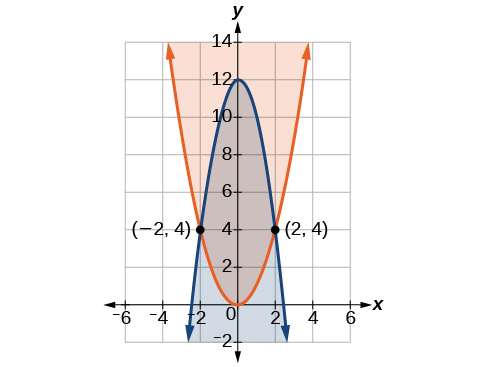
Graph the given system of inequalities.
These two equations are clearly parabolas. We can find the points of intersection by the elimination process: Add both equations and the variable
will be eliminated. Then we solve for
Substitute the
x -values into one of the equations and solve for
The two points of intersection are
and
Notice that the equations can be rewritten as follows.
Graph each inequality. See
[link] . The feasible region is the region between the two equations bounded by
on the top and
on the bottom.
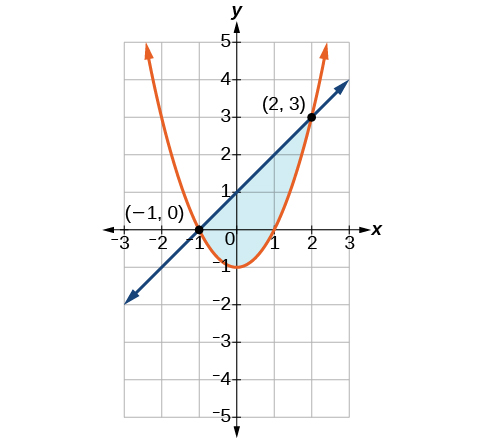
There are three possible types of solutions to a system of equations representing a line and a parabola: (1) no solution, the line does not intersect the parabola; (2) one solution, the line is tangent to the parabola; and (3) two solutions, the line intersects the parabola in two points. See
[link] .
There are three possible types of solutions to a system of equations representing a circle and a line: (1) no solution, the line does not intersect the circle; (2) one solution, the line is tangent to the parabola; (3) two solutions, the line intersects the circle in two points. See
[link] .
There are five possible types of solutions to the system of nonlinear equations representing an ellipse and a circle:
(1) no solution, the circle and the ellipse do not intersect; (2) one solution, the circle and the ellipse are tangent to each other; (3) two solutions, the circle and the ellipse intersect in two points; (4) three solutions, the circle and ellipse intersect in three places; (5) four solutions, the circle and the ellipse intersect in four points. See
[link] .
An inequality is graphed in much the same way as an equation, except for>or<, we draw a dashed line and shade the region containing the solution set. See
[link] .
Inequalities are solved the same way as equalities, but solutions to systems of inequalities must satisfy both inequalities. See
[link] .
Step 1: Find the mean. To find the mean, add up all the scores, then divide them by the number of scores. ...
Step 2: Find each score's deviation from the mean. ...
Step 3: Square each deviation from the mean. ...
Step 4: Find the sum of squares. ...
Step 5: Divide the sum of squares by n – 1 or N.
The sample of 16 students is taken. The average age in the sample was 22 years with astandard deviation of 6 years. Construct a 95% confidence interval for the age of the population.
Bhartdarshan' is an internet-based travel agency wherein customer can see videos of the cities they plant to visit. The number of hits daily is a normally distributed random variable with a mean of 10,000 and a standard deviation of 2,400
a. what is the probability of getting more than 12,000 hits?
b. what is the probability of getting fewer than 9,000 hits?
Bhartdarshan'is an internet-based travel agency wherein customer can see videos of the cities they plan to visit. The number of hits daily is a normally distributed random variable with a mean of 10,000 and a standard deviation of 2,400.
a. What is the probability of getting more than 12,000 hits