<< Chapter < Page Chapter >> Page >
In this section, you will:
  • Identify nondegenerate conic sections given their general form equations.
  • Use rotation of axes formulas.
  • Write equations of rotated conics in standard form.
  • Identify conics without rotating axes.

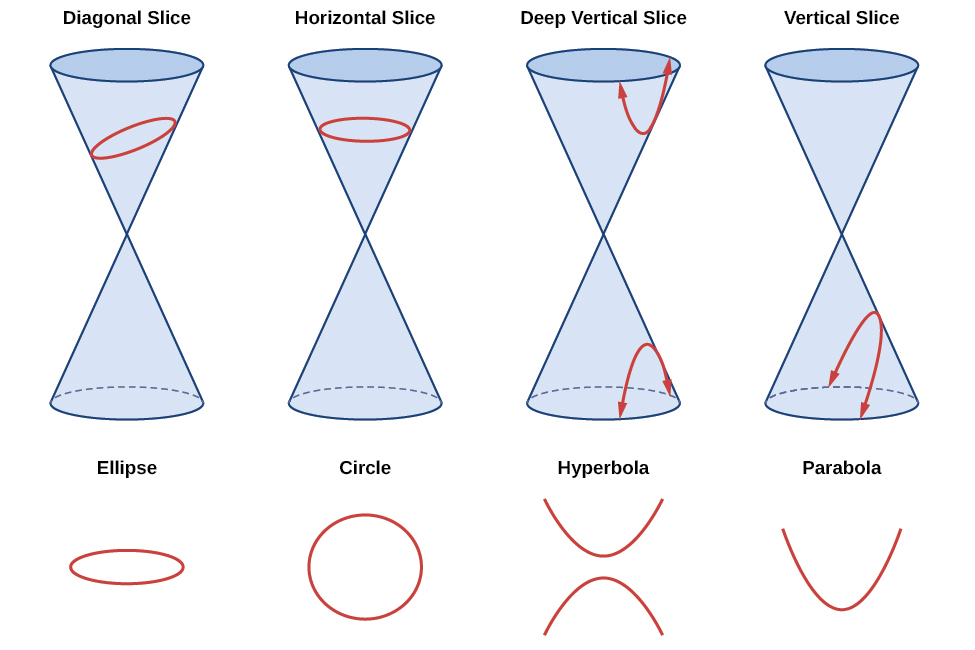
As we have seen, conic sections are formed when a plane intersects two right circular cones aligned tip to tip and extending infinitely far in opposite directions, which we also call a cone . The way in which we slice the cone will determine the type of conic section formed at the intersection. A circle is formed by slicing a cone with a plane perpendicular to the axis of symmetry of the cone. An ellipse is formed by slicing a single cone with a slanted plane not perpendicular to the axis of symmetry. A parabola is formed by slicing the plane through the top or bottom of the double-cone, whereas a hyperbola is formed when the plane slices both the top and bottom of the cone. See [link] .

The nondegenerate conic sections

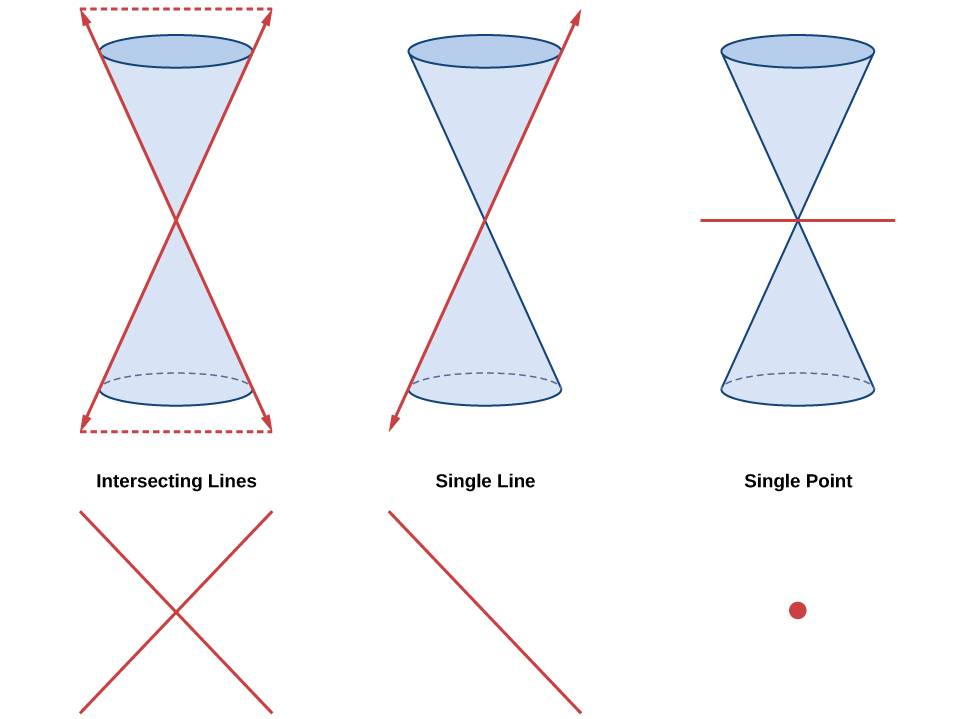
Ellipses, circles, hyperbolas, and parabolas are sometimes called the nondegenerate conic sections , in contrast to the degenerate conic sections    , which are shown in [link] . A degenerate conic results when a plane intersects the double cone and passes through the apex. Depending on the angle of the plane, three types of degenerate conic sections are possible: a point, a line, or two intersecting lines.

Degenerate conic sections

Identifying nondegenerate conics in general form

In previous sections of this chapter, we have focused on the standard form equations for nondegenerate conic sections. In this section, we will shift our focus to the general form equation, which can be used for any conic. The general form is set equal to zero, and the terms and coefficients are given in a particular order, as shown below.

A x 2 + B x y + C y 2 + D x + E y + F = 0

where A , B , and C are not all zero. We can use the values of the coefficients to identify which type conic is represented by a given equation.

You may notice that the general form equation has an x y term that we have not seen in any of the standard form equations. As we will discuss later, the x y term rotates the conic whenever   B   is not equal to zero.

Conic Sections Example
ellipse 4 x 2 + 9 y 2 = 1
circle 4 x 2 + 4 y 2 = 1
hyperbola 4 x 2 9 y 2 = 1
parabola 4 x 2 = 9 y  or  4 y 2 = 9 x
one line 4 x + 9 y = 1
intersecting lines ( x 4 ) ( y + 4 ) = 0
parallel lines ( x 4 ) ( x 9 ) = 0
a point 4 x 2 + 4 y 2 = 0
no graph 4 x 2 + 4 y 2 = 1

General form of conic sections

A conic section    has the general form

A x 2 + B x y + C y 2 + D x + E y + F = 0

where A , B , and C are not all zero.

[link] summarizes the different conic sections where B = 0 , and A and C are nonzero real numbers. This indicates that the conic has not been rotated.

ellipse A x 2 + C y 2 + D x + E y + F = 0 ,   A C  and  A C > 0
circle A x 2 + C y 2 + D x + E y + F = 0 ,   A = C
hyperbola A x 2 C y 2 + D x + E y + F = 0  or  A x 2 + C y 2 + D x + E y + F = 0 , where A and C are positive
parabola A x 2 + D x + E y + F = 0  or  C y 2 + D x + E y + F = 0

Given the equation of a conic, identify the type of conic.

  1. Rewrite the equation in the general form, A x 2 + B x y + C y 2 + D x + E y + F = 0.
  2. Identify the values of A and C from the general form.
    1. If A and C are nonzero, have the same sign, and are not equal to each other, then the graph may be an ellipse.
    2. If A and C are equal and nonzero and have the same sign, then the graph may be a circle.
    3. If A and C are nonzero and have opposite signs, then the graph may be a hyperbola.
    4. If either A or C is zero, then the graph may be a parabola.

    If B = 0, the conic section will have a vertical and/or horizontal axes. If B does not equal 0, as shown below, the conic section is rotated. Notice the phrase “may be” in the definitions. That is because the equation may not represent a conic section at all, depending on the values of A , B , C , D , E , and F . For example, the degenerate case of a circle or an ellipse is a point:
    A x 2 + B y 2 = 0 , when A and B have the same sign.
    The degenerate case of a hyperbola is two intersecting straight lines: A x 2 + B y 2 = 0 , when A and B have opposite signs.
    On the other hand, the equation, A x 2 + B y 2 + 1 = 0 , when A and B are positive does not represent a graph at all, since there are no real ordered pairs which satisfy it.

Questions & Answers

differentiate between demand and supply giving examples
Lambiv Reply
differentiated between demand and supply using examples
Lambiv
what is labour ?
Lambiv
how will I do?
Venny Reply
how is the graph works?I don't fully understand
Rezat Reply
information
Eliyee
devaluation
Eliyee
t
WARKISA
hi guys good evening to all
Lambiv
multiple choice question
Aster Reply
appreciation
Eliyee
explain perfect market
Lindiwe Reply
In economics, a perfect market refers to a theoretical construct where all participants have perfect information, goods are homogenous, there are no barriers to entry or exit, and prices are determined solely by supply and demand. It's an idealized model used for analysis,
Ezea
What is ceteris paribus?
Shukri Reply
other things being equal
AI-Robot
When MP₁ becomes negative, TP start to decline. Extuples Suppose that the short-run production function of certain cut-flower firm is given by: Q=4KL-0.6K2 - 0.112 • Where is quantity of cut flower produced, I is labour input and K is fixed capital input (K-5). Determine the average product of lab
Kelo
Extuples Suppose that the short-run production function of certain cut-flower firm is given by: Q=4KL-0.6K2 - 0.112 • Where is quantity of cut flower produced, I is labour input and K is fixed capital input (K-5). Determine the average product of labour (APL) and marginal product of labour (MPL)
Kelo
yes,thank you
Shukri
Can I ask you other question?
Shukri
what is monopoly mean?
Habtamu Reply
What is different between quantity demand and demand?
Shukri Reply
Quantity demanded refers to the specific amount of a good or service that consumers are willing and able to purchase at a give price and within a specific time period. Demand, on the other hand, is a broader concept that encompasses the entire relationship between price and quantity demanded
Ezea
ok
Shukri
how do you save a country economic situation when it's falling apart
Lilia Reply
what is the difference between economic growth and development
Fiker Reply
Economic growth as an increase in the production and consumption of goods and services within an economy.but Economic development as a broader concept that encompasses not only economic growth but also social & human well being.
Shukri
production function means
Jabir
What do you think is more important to focus on when considering inequality ?
Abdisa Reply
any question about economics?
Awais Reply
sir...I just want to ask one question... Define the term contract curve? if you are free please help me to find this answer 🙏
Asui
it is a curve that we get after connecting the pareto optimal combinations of two consumers after their mutually beneficial trade offs
Awais
thank you so much 👍 sir
Asui
In economics, the contract curve refers to the set of points in an Edgeworth box diagram where both parties involved in a trade cannot be made better off without making one of them worse off. It represents the Pareto efficient allocations of goods between two individuals or entities, where neither p
Cornelius
In economics, the contract curve refers to the set of points in an Edgeworth box diagram where both parties involved in a trade cannot be made better off without making one of them worse off. It represents the Pareto efficient allocations of goods between two individuals or entities,
Cornelius
Suppose a consumer consuming two commodities X and Y has The following utility function u=X0.4 Y0.6. If the price of the X and Y are 2 and 3 respectively and income Constraint is birr 50. A,Calculate quantities of x and y which maximize utility. B,Calculate value of Lagrange multiplier. C,Calculate quantities of X and Y consumed with a given price. D,alculate optimum level of output .
Feyisa Reply
Answer
Feyisa
c
Jabir
the market for lemon has 10 potential consumers, each having an individual demand curve p=101-10Qi, where p is price in dollar's per cup and Qi is the number of cups demanded per week by the i th consumer.Find the market demand curve using algebra. Draw an individual demand curve and the market dema
Gsbwnw Reply
suppose the production function is given by ( L, K)=L¼K¾.assuming capital is fixed find APL and MPL. consider the following short run production function:Q=6L²-0.4L³ a) find the value of L that maximizes output b)find the value of L that maximizes marginal product
Abdureman
types of unemployment
Yomi Reply
What is the difference between perfect competition and monopolistic competition?
Mohammed
Got questions? Join the online conversation and get instant answers!
Jobilize.com Reply
Practice Key Terms 3

Get Jobilize Job Search Mobile App in your pocket Now!

Get it on Google Play Download on the App Store Now


Source:  OpenStax, Precalculus. OpenStax CNX. Jan 19, 2016 Download for free at https://legacy.cnx.org/content/col11667/1.6
Google Play and the Google Play logo are trademarks of Google Inc.

Notification Switch

Would you like to follow the 'Precalculus' conversation and receive update notifications?

Ask