Throughout this section, we have learned about types of variations of sine and cosine functions and used that information to write equations from graphs. Now we can use the same information to create graphs from equations.
Instead of focusing on the general form equations
we will let
and
and work with a simplified form of the equations in the following examples.
Given the function
sketch its graph.
Identify the amplitude,
Identify the period,
Start at the origin, with the function increasing to the right if
is positive or decreasing if
is negative.
At
there is a local maximum for
or a minimum for
with
The curve returns to the
x -axis at
There is a local minimum for
(maximum for
) at
with
The curve returns again to the
x -axis at
Graphing a function and identifying the amplitude and period
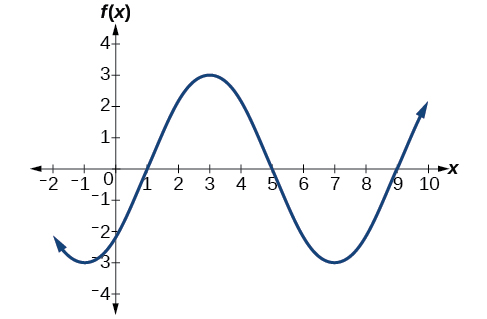
Sketch a graph of
Let’s begin by comparing the equation to the form
Step 1. We can see from the equation that
so the amplitude is 2.
Step 2. The equation shows that
so the period is
Step 3. Because
is negative, the graph descends as we move to the right of the origin.
Step 4–7. The
x -intercepts are at the beginning of one period,
the horizontal midpoints are at
and at the end of one period at
The quarter points include the minimum at
and the maximum at
A local minimum will occur 2 units below the midline, at
and a local maximum will occur at 2 units above the midline, at
[link] shows the graph of the function.
Given a sinusoidal function with a phase shift and a vertical shift, sketch its graph.
Express the function in the general form
Identify the amplitude,
Identify the period,
Identify the phase shift,
Draw the graph of
shifted to the right or left by
and up or down by
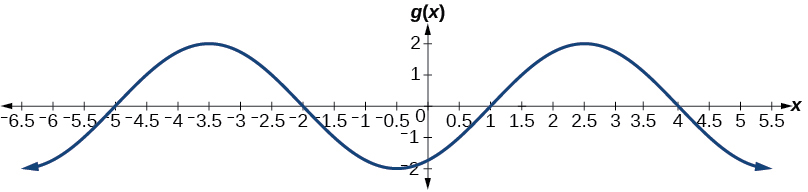
Graphing a transformed sinusoid
Sketch a graph of
Step 1. The function is already written in general form:
This graph will have the shape of a
sine function , starting at the midline and increasing to the right.
Step 2.
The amplitude is 3.
Step 3. Since
we determine the period as follows.
The period is 8.
Step 4. Since
the phase shift is
The phase shift is 1 unit.
Step 5.[link] shows the graph of the function.
A horizontally compressed, vertically stretched, and horizontally shifted sinusoid
is it possible to leave every good at the same level
Joseph
I don't think so. because check it, if the demand for chicken increases, people will no longer consume fish like they used to causing a fall in the demand for fish
Anuolu
is not really possible to let the value of a goods to be same at the same time.....
Salome
Suppose the inflation rate is 6%, does it mean that all the goods you purchase will cost
6% more than previous year? Provide with reasoning.
Not necessarily. To measure the inflation rate economists normally use an averaged price index of a basket of certain goods. So if you purchase goods included in the basket, you will notice that you pay 6% more, otherwise not necessarily.
Good day
How do I calculate this question: C= 100+5yd G= 2000 T= 2000 I(planned)=200.
Suppose the actual output is 3000. What is the level of planned expenditures at this level of output?
I am Camara from Guinea west Africa... happy to meet you guys here
Sekou
ma management ho
Amisha
ahile becheclor ho
Amisha
hjr ktm bta ho
ani k kaam grnu hunxa tw
Amisha
belatari
Amisha
1st year ho
Amisha
nd u
Amisha
ahh
Amisha
kaha biratnagar
Amisha
ys
Amisha
kina k vo
Amisha
money as unit of account means what?
Kalombe
A unit of account is something that can be used to value goods and services and make calculations
Jim
all of you please speak in English I can't understand you're language
Muhammad
I want to know how can we define macroeconomics in one line
Muhammad
it must be .9 or 0.9
no Mpc is greater than 1
Y=100+.9Y+50
Y-.9Y=150
0.1Y/0.1=150/0.1
Y=1500
Kalombe
Mercy is it clear?😋
Kalombe
hi can someone help me on this question
If a negative shocks shifts the IS curve to the left, what type of policy do you suggest so as to stabilize the level of output?
discuss your answer using appropriate graph.


![A graph of 4sin((pi/5)x-pi/5)+4. Graph has period of 10, amplitude of 4, range of [0,8].](/ocw/mirror/col11667/m49387/CNX_Precalc_Figure_06_01_018n.jpg)
![A graph of -2sin((pi/2)x). Graph has range of [-2,2], period of 4, and amplitude of 2.](/ocw/mirror/col11667/m49387/CNX_Precalc_Figure_06_01_019.jpg)
![A graph of -0.8cos(2x). Graph has range of [-0.8, 0.8], period of pi, amplitude of 0.8, and is reflected about the x-axis compared to it's parent function cos(x).](/ocw/mirror/col11667/m49387/CNX_Precalc_Figure_06_01_020.jpg)