Throughout this section, we have learned about types of variations of sine and cosine functions and used that information to write equations from graphs. Now we can use the same information to create graphs from equations.
Instead of focusing on the general form equations
we will let
and
and work with a simplified form of the equations in the following examples.
Given the function
sketch its graph.
Identify the amplitude,
Identify the period,
Start at the origin, with the function increasing to the right if
is positive or decreasing if
is negative.
At
there is a local maximum for
or a minimum for
with
The curve returns to the
x -axis at
There is a local minimum for
(maximum for
) at
with
The curve returns again to the
x -axis at
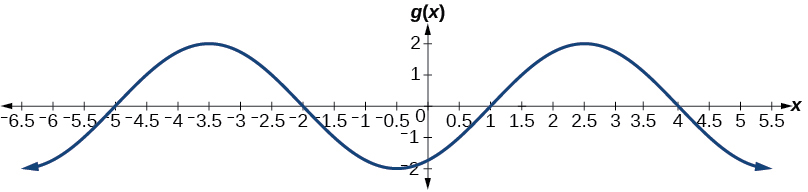
Graphing a function and identifying the amplitude and period
Sketch a graph of
Let’s begin by comparing the equation to the form
Step 1. We can see from the equation that
so the amplitude is 2.
Step 2. The equation shows that
so the period is
Step 3. Because
is negative, the graph descends as we move to the right of the origin.
Step 4–7. The
x -intercepts are at the beginning of one period,
the horizontal midpoints are at
and at the end of one period at
The quarter points include the minimum at
and the maximum at
A local minimum will occur 2 units below the midline, at
and a local maximum will occur at 2 units above the midline, at
[link] shows the graph of the function.
Given a sinusoidal function with a phase shift and a vertical shift, sketch its graph.
Express the function in the general form
Identify the amplitude,
Identify the period,
Identify the phase shift,
Draw the graph of
shifted to the right or left by
and up or down by
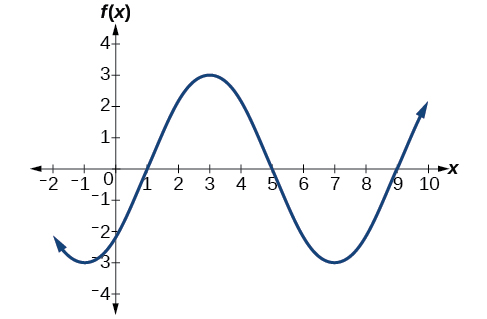
Graphing a transformed sinusoid
Sketch a graph of
Step 1. The function is already written in general form:
This graph will have the shape of a
sine function , starting at the midline and increasing to the right.
Step 2.
The amplitude is 3.
Step 3. Since
we determine the period as follows.
The period is 8.
Step 4. Since
the phase shift is
The phase shift is 1 unit.
Step 5.[link] shows the graph of the function.
A horizontally compressed, vertically stretched, and horizontally shifted sinusoid
In economics, a perfect market refers to a theoretical construct where all participants have perfect information, goods are homogenous, there are no barriers to entry or exit, and prices are determined solely by supply and demand. It's an idealized model used for analysis,
When MP₁ becomes negative, TP start to decline.
Extuples Suppose that the short-run production function of certain cut-flower firm is given by: Q=4KL-0.6K2 - 0.112 •
Where is quantity of cut flower produced, I is labour input and K is fixed capital input (K-5). Determine the average product of lab
Kelo
Extuples Suppose that the short-run production function of certain cut-flower firm is given by: Q=4KL-0.6K2 - 0.112 •
Where is quantity of cut flower produced, I is labour input and K is fixed capital input (K-5). Determine the average product of labour (APL) and marginal product of labour (MPL)
Quantity demanded refers to the specific amount of a good or service that consumers are willing and able to purchase at a give price and within a specific time period. Demand, on the other hand, is a broader concept that encompasses the entire relationship between price and quantity demanded
Ezea
ok
Shukri
how do you save a country economic situation when it's falling apart
Economic growth as an increase in the production and consumption of goods and services within an economy.but
Economic development as a broader concept that encompasses not only economic growth but also social & human well being.
Shukri
production function means
Jabir
What do you think is more important to focus on when considering inequality ?
sir...I just want to ask one question... Define the term contract curve? if you are free please help me to find this answer 🙏
Asui
it is a curve that we get after connecting the pareto optimal combinations of two consumers after their mutually beneficial trade offs
Awais
thank you so much 👍 sir
Asui
In economics, the contract curve refers to the set of points in an Edgeworth box diagram where both parties involved in a trade cannot be made better off without making one of them worse off. It represents the Pareto efficient allocations of goods between two individuals or entities, where neither p
Cornelius
In economics, the contract curve refers to the set of points in an Edgeworth box diagram where both parties involved in a trade cannot be made better off without making one of them worse off. It represents the Pareto efficient allocations of goods between two individuals or entities,
Cornelius
Suppose a consumer consuming two commodities X and Y has
The following utility function u=X0.4 Y0.6. If the price of the X and Y are 2 and 3 respectively and income Constraint is birr 50.
A,Calculate quantities of x and y which maximize utility.
B,Calculate value of Lagrange multiplier.
C,Calculate quantities of X and Y consumed with a given price.
D,alculate optimum level of output .
the market for lemon has 10 potential consumers, each having an individual demand curve p=101-10Qi, where p is price in dollar's per cup and Qi is the number of cups demanded per week by the i th consumer.Find the market demand curve using algebra. Draw an individual demand curve and the market dema
suppose the production function is given by ( L, K)=L¼K¾.assuming capital is fixed find APL and MPL. consider the following short run production function:Q=6L²-0.4L³ a) find the value of L that maximizes output b)find the value of L that maximizes marginal product
Abdureman
Got questions? Join the online conversation and get instant answers!


![A graph of 4sin((pi/5)x-pi/5)+4. Graph has period of 10, amplitude of 4, range of [0,8].](/ocw/mirror/col11667/m49387/CNX_Precalc_Figure_06_01_018n.jpg)
![A graph of -2sin((pi/2)x). Graph has range of [-2,2], period of 4, and amplitude of 2.](/ocw/mirror/col11667/m49387/CNX_Precalc_Figure_06_01_019.jpg)
![A graph of -0.8cos(2x). Graph has range of [-0.8, 0.8], period of pi, amplitude of 0.8, and is reflected about the x-axis compared to it's parent function cos(x).](/ocw/mirror/col11667/m49387/CNX_Precalc_Figure_06_01_020.jpg)