| << Chapter < Page | Chapter >> Page > |
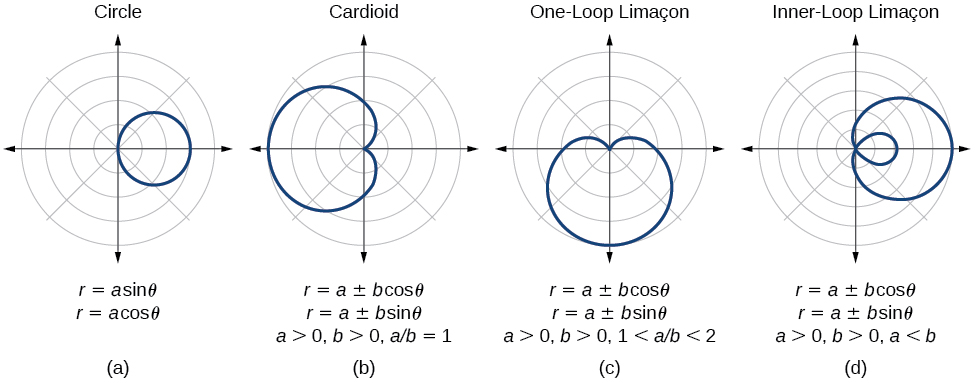
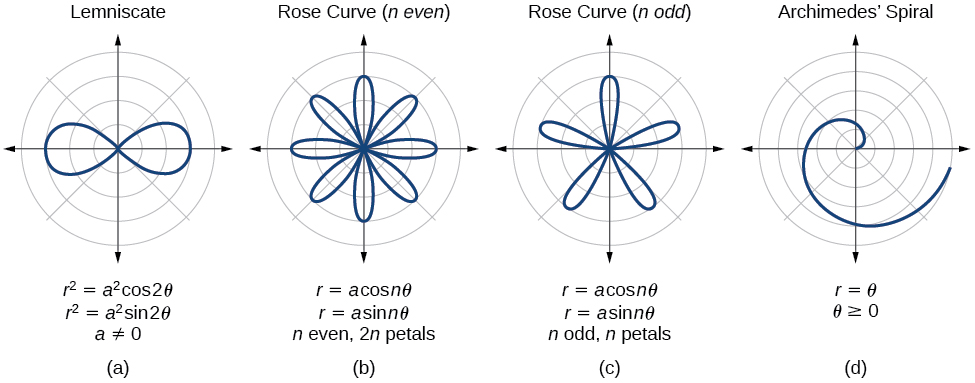
We have explored a number of seemingly complex polar curves in this section. [link] and [link] summarize the graphs and equations for each of these curves.


Access these online resources for additional instruction and practice with graphs of polar coordinates.
Describe the three types of symmetry in polar graphs, and compare them to the symmetry of the Cartesian plane.
Symmetry with respect to the polar axis is similar to symmetry about the -axis, symmetry with respect to the pole is similar to symmetry about the origin, and symmetric with respect to the line is similar to symmetry about the -axis.
Which of the three types of symmetries for polar graphs correspond to the symmetries with respect to the x -axis, y -axis, and origin?
What are the steps to follow when graphing polar equations?
Test for symmetry; find zeros, intercepts, and maxima; make a table of values. Decide the general type of graph, cardioid, limaçon, lemniscate, etc., then plot points at and sketch the graph.
Describe the shapes of the graphs of cardioids, limaçons, and lemniscates.
What part of the equation determines the shape of the graph of a polar equation?
The shape of the polar graph is determined by whether or not it includes a sine, a cosine, and constants in the equation.
For the following exercises, test the equation for symmetry.
symmetric with respect to the polar axis, symmetric with respect to the line symmetric with respect to the pole
For the following exercises, graph the polar equation. Identify the name of the shape.
For the following exercises, use a graphing calculator to sketch the graph of the polar equation.
a cissoid
For the following exercises, use a graphing utility to graph each pair of polar equations on a domain of and then explain the differences shown in the graphs.
Both graphs are curves with 2 loops. The equation with a coefficient of has two loops on the left, the equation with a coefficient of 2 has two loops side by side. Graph these from 0 to to get a better picture.
On a graphing utility, graph on and Describe the effect of increasing the width of the domain.
When the width of the domain is increased, more petals of the flower are visible.
On a graphing utility, graph and sketch on
On a graphing utility, graph each polar equation. Explain the similarities and differences you observe in the graphs.
The graphs are three-petal, rose curves. The larger the coefficient, the greater the curve’s distance from the pole.
On a graphing utility, graph each polar equation. Explain the similarities and differences you observe in the graphs.
On a graphing utility, graph each polar equation. Explain the similarities and differences you observe in the graphs.
The graphs are spirals. The smaller the coefficient, the tighter the spiral.
For the following exercises, draw each polar equation on the same set of polar axes, and find the points of intersection.

Notification Switch
Would you like to follow the 'Precalculus' conversation and receive update notifications?