

| << Chapter < Page | Chapter >> Page > |
A runner runs along a straight east-west road. The function gives how many feet eastward of her starting point she is after seconds. Interpret each of the following as it relates to the runner.
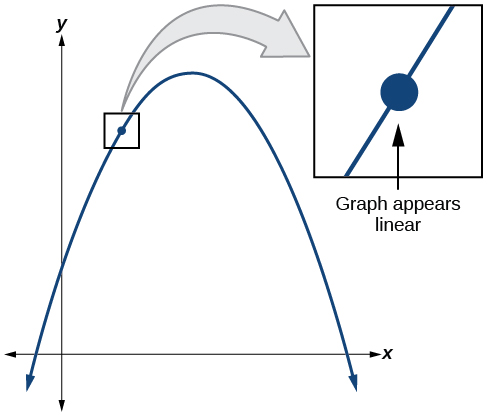
To understand where a function’s derivative does not exist, we need to recall what normally happens when a function has a derivative at . Suppose we use a graphing utility to zoom in on . If the function is differentiable , that is, if it is a function that can be differentiated, then the closer one zooms in, the more closely the graph approaches a straight line. This characteristic is called linearity .
Look at the graph in [link] . The closer we zoom in on the point, the more linear the curve appears.
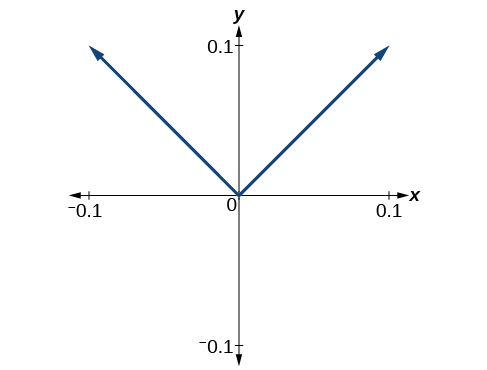
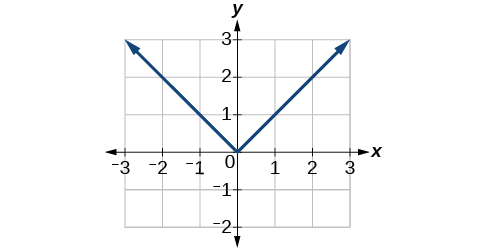
We might presume the same thing would happen with any continuous function, but that is not so. The function for example, is continuous at but not differentiable at As we zoom in close to 0 in [link] , the graph does not approach a straight line. No matter how close we zoom in, the graph maintains its sharp corner.
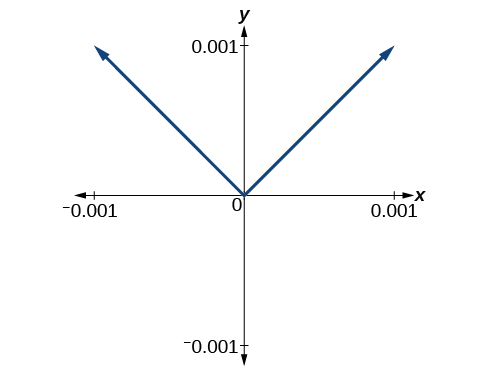
We zoom in closer by narrowing the range to produce [link] and continue to observe the same shape. This graph does not appear linear at
What are the characteristics of a graph that is not differentiable at a point? Here are some examples in which function is not differentiable at
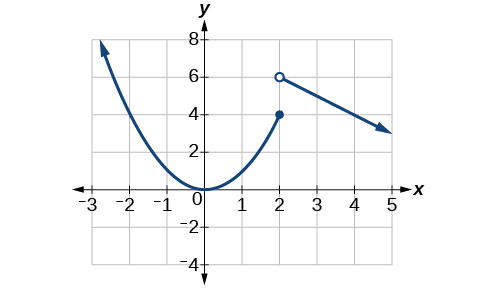
In [link] , we see the graph of
Notice that, as approaches 2 from the left, the left-hand limit may be observed to be 4, while as approaches 2 from the right, the right-hand limit may be observed to be 6. We see that it has a discontinuity at
In [link] , we see the graph of We see that the graph has a corner point at
In [link] , we see that the graph of has a cusp at A cusp has a unique feature. Moving away from the cusp, both the left-hand and right-hand limits approach either infinity or negative infinity. Notice the tangent lines as approaches 0 from both the left and the right appear to get increasingly steeper, but one has a negative slope, the other has a positive slope.
![Graph of f(x) = x^(2/3) with a viewing window of [-3, 3] by [-2, 3].](/ocw/mirror/col11667/m49455/CNX_Precalc_Figure_12_04_013.jpg)
In [link] , we see that the graph of has a vertical tangent at Recall that vertical tangents are vertical lines, so where a vertical tangent exists, the slope of the line is undefined. This is why the derivative, which measures the slope, does not exist there.
Notification Switch
Would you like to follow the 'Precalculus' conversation and receive update notifications?

|
|
|
|
|

|
|

|
|

|
|

|
|

|
|
|
|
|

|
|

|
|

|
|
|
|