| << Chapter < Page | Chapter >> Page > |
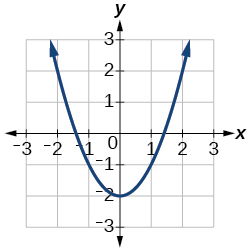
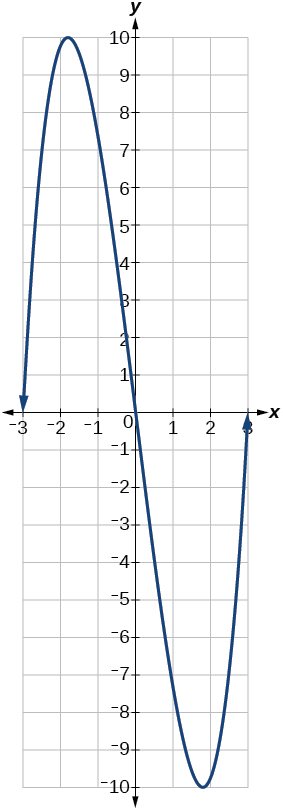
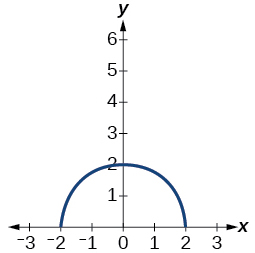
For the following exercises, use the vertical line test to determine if the relation whose graph is provided is a function.
For the following exercises, graph the functions.
For the following exercises, use [link] to approximate the values.

If then solve for
For the following exercises, use the function to find the values.
For the following exercises, find the domain of each function, expressing answers using interval notation.
For the following exercises, find the average rate of change of the functions from
For the following exercises, use the graphs to determine the intervals on which the functions are increasing, decreasing, or constant.
Find the local minimum of the function graphed in [link] .
Find the local extrema for the function graphed in [link] .
local minimum local maximum
For the graph in [link] , the domain of the function is The range is Find the absolute minimum of the function on this interval.
Find the absolute maximum of the function graphed in [link] .

For the following exercises, find and for each pair of functions.
For the following exercises, find and the domain for for each pair of functions.
For the following exercises, express each function as a composition of two functions and where
For the following exercises, sketch a graph of the given function.
For the following exercises, sketch the graph of the function if the graph of the function is shown in [link] .

For the following exercises, write the equation for the standard function represented by each of the graphs below.
For the following exercises, determine whether each function below is even, odd, or neither.
For the following exercises, analyze the graph and determine whether the graphed function is even, odd, or neither.
For the following exercises, write an equation for the transformation of
For the following exercises, graph the absolute value function.

Notification Switch
Would you like to follow the 'Precalculus' conversation and receive update notifications?