As part of the results, your calculator will display a number known as the
correlation coefficient , labeled by the variable
or
(You may have to change the calculator’s settings for these to be shown.) The values are an indication of the “goodness of fit” of the regression equation to the data. We more commonly use the value of
instead of
but the closer either value is to 1, the better the regression equation approximates the data.
Exponential regression
Exponential regression is used to model situations in which growth begins slowly and then accelerates rapidly without bound, or where decay begins rapidly and then slows down to get closer and closer to zero. We use the command “ExpReg” on a graphing utility to fit an exponential function to a set of data points. This returns an equation of the form,
Note that:
must be non-negative.
when
we have an exponential growth model.
when
we have an exponential decay model.
Given a set of data, perform exponential regression using a graphing utility.
Use the STAT then EDIT menu to enter given data.
Clear any existing data from the lists.
List the input values in the L1 column.
List the output values in the L2 column.
Graph and observe a scatter plot of the data using the STATPLOT feature.
Use ZOOM [9] to adjust axes to fit the data.
Verify the data follow an exponential pattern.
Find the equation that models the data.
Select “ExpReg” from the STAT then CALC menu.
Use the values returned for
a and
b to record the model,
Graph the model in the same window as the scatterplot to verify it is a good fit for the data.
Using exponential regression to fit a model to data
In 2007, a university study was published investigating the crash risk of alcohol impaired driving. Data from 2,871 crashes were used to measure the association of a person’s blood alcohol level (BAC) with the risk of being in an accident.
[link] shows results from the study
Source:
Indiana University Center for Studies of Law in Action, 2007 . The
relative risk is a measure of how many times more likely a person is to crash. So, for example, a person with a BAC of 0.09 is 3.54 times as likely to crash as a person who has not been drinking alcohol.
BAC
0
0.01
0.03
0.05
0.07
0.09
Relative Risk of Crashing
1
1.03
1.06
1.38
2.09
3.54
BAC
0.11
0.13
0.15
0.17
0.19
0.21
Relative Risk of Crashing
6.41
12.6
22.1
39.05
65.32
99.78
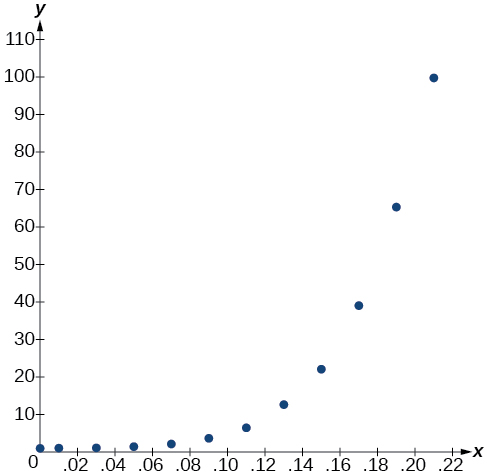
Let
represent the BAC level, and let
represent the corresponding relative risk. Use exponential regression to fit a model to these data.
After 6 drinks, a person weighing 160 pounds will have a BAC of about
How many times more likely is a person with this weight to crash if they drive after having a 6-pack of beer? Round to the nearest hundredth.
Using the STAT then EDIT menu on a graphing utility, list the BAC values in L1 and the relative risk values in L2. Then use the STATPLOT feature to verify that the scatterplot follows the exponential pattern shown in
[link] :
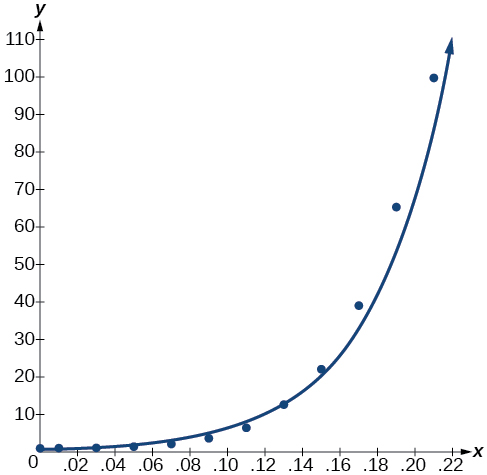
Use the “ExpReg” command from the STAT then CALC menu to obtain the exponential model,
Converting from scientific notation, we have:
Notice that
which indicates the model is a good fit to the data. To see this, graph the model in the same window as the scatterplot to verify it is a good fit as shown in
[link] :
Use the model to estimate the risk associated with a BAC of
Substitute
for
in the model and solve for
If a 160-pound person drives after having 6 drinks, he or she is about 26.35 times more likely to crash than if driving while sober.
the study of living organisms and their interactions with one another and their environment.
Wine
discuss the biological phenomenon and provide pieces of evidence to show that it was responsible for the formation of eukaryotic organelles in an essay form
advantage of electronic microscope is easily and clearly while disadvantage is dangerous because its electronic. advantage of light microscope is savely and naturally by sun while disadvantage is not easily,means its not sharp and not clear
Abdullahi
cell theory state that every organisms composed of one or more cell,cell is the basic unit of life
Abdullahi
is like gone fail us
DENG
cells is the basic structure and functions of all living things
A scanning electron microscope (SEM) is ideal for situations requiring high-resolution imaging of surfaces. It is commonly used in materials science, biology, and geology to examine the topography and composition of samples at a nanoscale level. SEM is particularly useful for studying fine details,
Hilary
Got questions? Join the online conversation and get instant answers!